
The Latest Solar Images
Note: All images on this website © 2018-2026 by Brian Cudnik and Prairie View A&M Physics. All rights reserved.
Observations are happening daily, except for most Saturdays, all Sundays, and holiday periods; and are governed by duty schedule, weather, and solar activity. When the Sun has very low activity (spotless), observations will be limited or non-existent. Whenever the Sun becomes active again, the observing program will become active as well, weather permitting. The Sun is expected to reach the maximum activity level of the current Cycle 25 solar cycle. So we anticipate more events in terms of active region size and number, and solar flares.
One can monitor the Sun via several websites that provide real-time images of the Sun. The website, https://www.solarmonitor.org/, has such images in six different channels. The numbers are the NOAA designations for active regions (with the “1” at the start of the designation removed for convenience). Another website with up-t0-date information on solar activity and other goings-on in the skies is www.spaceweather.com. Additional information about the Sun’s current activity can be obtained from https://www.swpc.noaa.gov/, and real-time full-disk H-alpha images from observatories around the world can be viewed at http://halpha.nso.edu/.
A typical observing run may last from one to four hours, depending on seeing considerations, weather, and other work responsibilities, but will include active region monitoring of available active regions and the collection of frames for high-resolution solar mosaics in H-alpha. Each session includes at least one mosaic, which is a series of images made of all parts of the Sun’s disk that can later be stitched together to form a whole-disk image. At the very least, this ensures that all visible features such as prominences, filaments, and active regions (sunspot groups) are all captured in image form at least once per session. Usually observations are carried out in the late morning hours, but an additional session may occur in the mid-afternoon hours and it will include its own mosaic. If a sunspot group is expected to be active, then it becomes a main focus for observation for extended periods of time.
Solar activity is summarized in each day’s entry below, based on the forecast discussion product issued by the Space Weather Prediction Center each morning, along with observed activity (or lack of) the day of the featured observations. Regions are numbered by the NOAA/SWPC and are often provided in four-digit format (e.g. 3327), although I and other sources use the full five-digit designation (13327). Solar flares are described in terms of their X-ray intensity and optical “importance” (apparent brightness and area covered). One can learn more about the X-ray class of solar flares often discussed below by going to this website: https://www.spaceweather.com/glossary/flareclasses.html. Finally the SWPC 3-day forecast for solar activity is provided at the end of each entry.
More information about solar flares can be found at these websites: https://www.swpc.noaa.gov/phenomena; https://www.space.com/solar-flares-effects-classification-formation; and https://www.spaceweatherlive.com/en/solar-activity/solar-flares.html. I have also found the following website to be very useful: spaceweatherlive.com
The solar images are recorded through a Meade 16-inch f/8 Cassegrain telescope equipped with a 0.3 Å Hydrogen-alpha filter and a 16-bit, 3326×2504 pixel SBIG STF-8300 CCD camera. The aperture of the scope is stopped to 4-7/8 inch by an energy-rejection filter, which renders the system an f/26. A neutral density filter is added to bring the sunlight intensity down by 90%. Each image is automatically dark-subtracted as it is saved and each exposure is 0.1 second long for the red off-band continuum images and 0.5 second for the on-band H-alpha images. Flat field images are taken at periodic intervals throughout the observing session and are obtained by training the telescope to focus near the center of the Sun’s disk. Five images are then taken while dithering the frame 1′ to 5′ N,S,E, and W. The idea is to try to get images that are slightly blurred (either due to seeing or scope motion) and off set from each other. A set of 30 bias images (0-second exposures with the dome closed and scope parked) are taken at the end of each observing session.
Select images are processed for further study and display. A program called MaxIM DL is used to do basic calibration (bias-subtraction and flat field correction), and the levels are adjusted for optimum display contrast. Choice images are then selected for online display. All of the images are archived in their raw FITS format, sorted by date, and backed up twice. At a later time we can mass process these and make them available for scientific use. Inquiries can be made of Brian Cudnik, at bmcudnik@pvamu.edu, or Premkumar Saganti, at pbsaganti@pvamu.edu.]
NOTE: Images of the March 14, 2025 total lunar eclipse are posted at https://www.pvamu.edu/pvso/cosmic-corner/total-lunar-eclipse-1/
NOTE: Images of the April 8, 2024 solar eclipse are posted at https://www.pvamu.edu/pvso/cosmic-corner/partial-solar-eclipse/.
Observations have been conducted since then at the PVSO, primarily with H-alpha. There was a period of time when magnetospheric data were collected but the work had primarily been regional H-alpha images of active regions and filaments. Regular observations continued through the mid-2000’s, then became more sporadic through 2015. After a five-year pause, regular observations resumed (in their current format) on 8 January 2020.
February 26, 2026
Solar activity reached moderate levels yesterday (25 February) due to an M2.3 flare from AR 14379 at 15:59 UT. This region is coming into better view as the Sun’s rotation carries it around the east limb. It is actually two regions, the trailing region was designated AR 14380. Today’s strongest event was a C6.3 flare at 19:09 UTC from beyond the east limb. Currently, three designated active regions are visible on the solar disk, with a small pair os spots appearing in the northwest quadrant of the disk (it has not yet been numbered). A 15 degree long filament erupted from the southeastern limb/disk of the Sun.
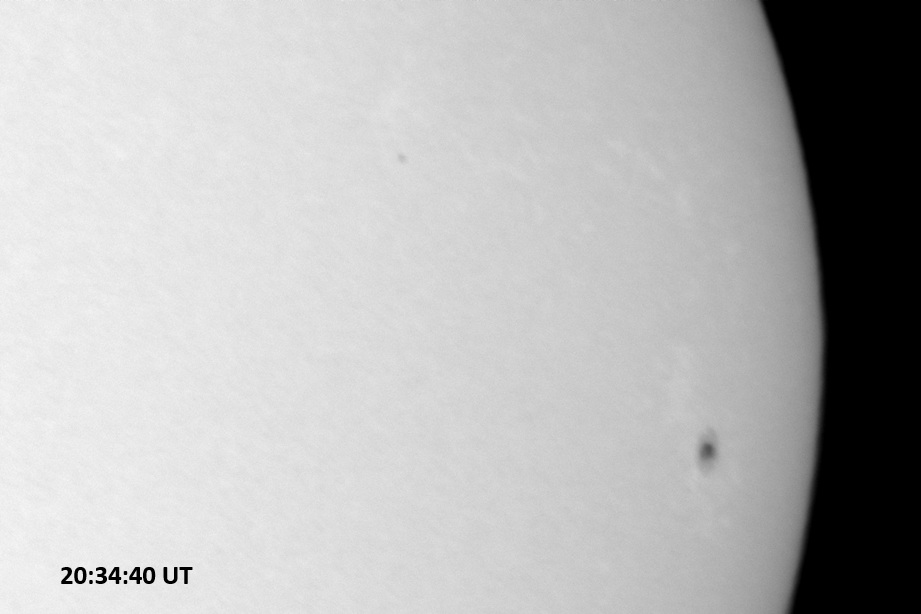
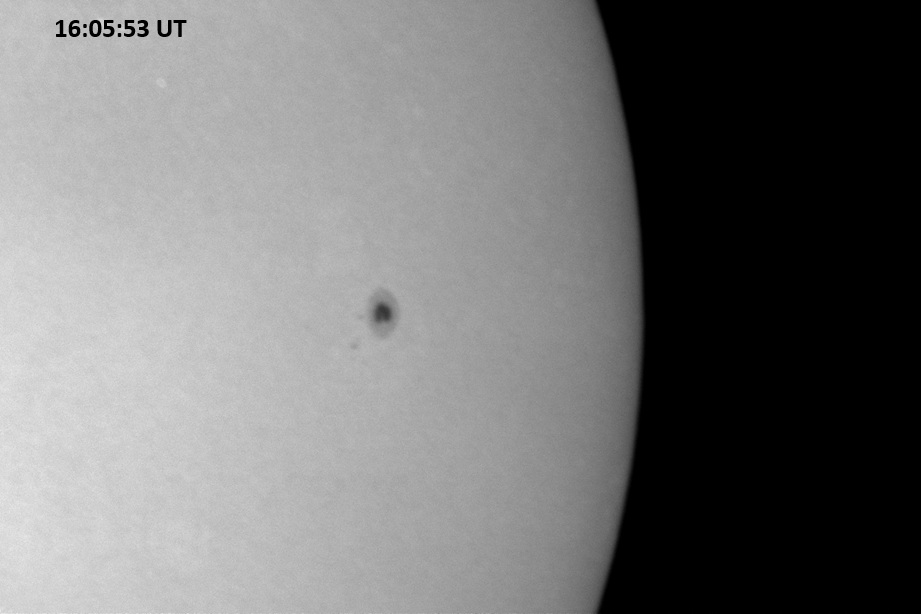
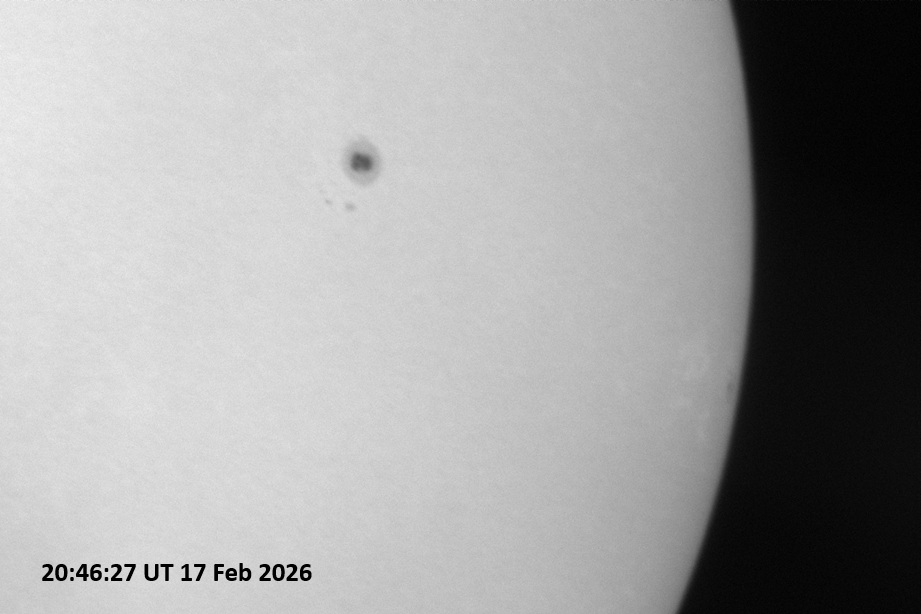
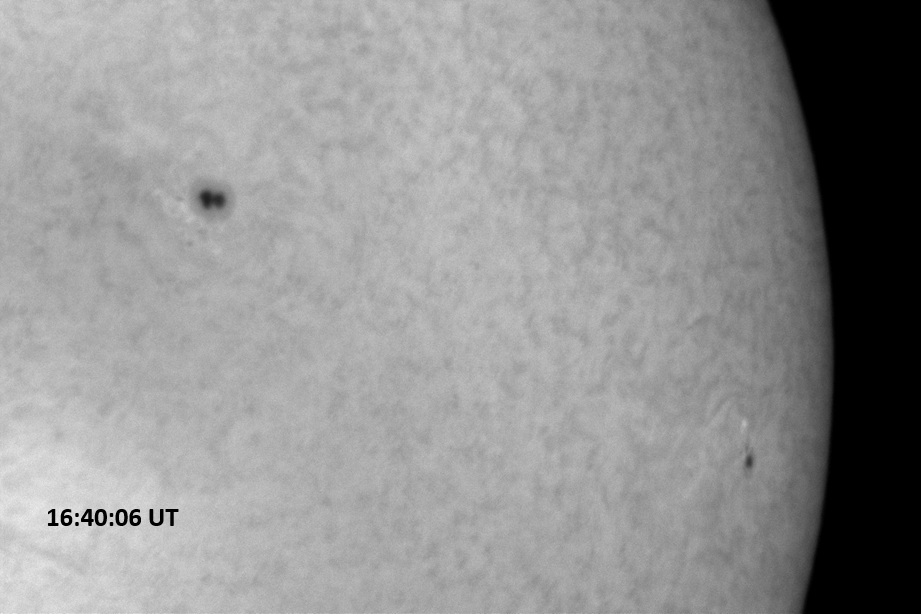
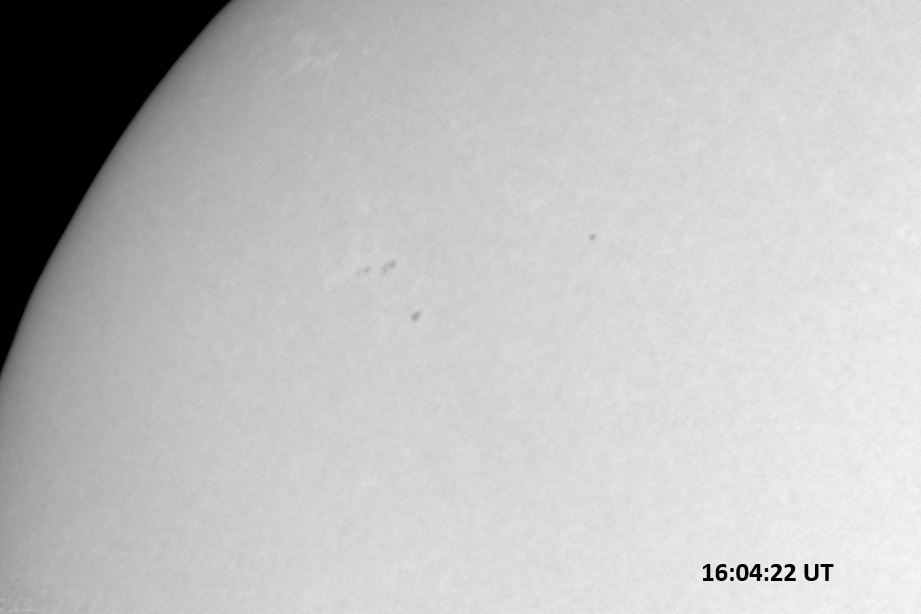
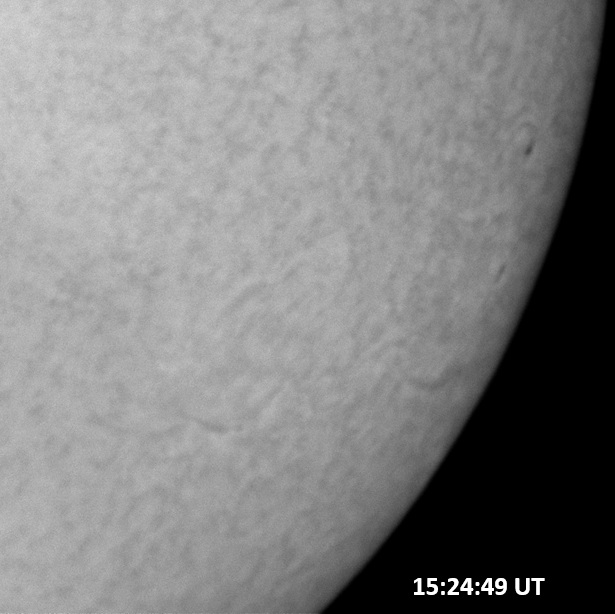
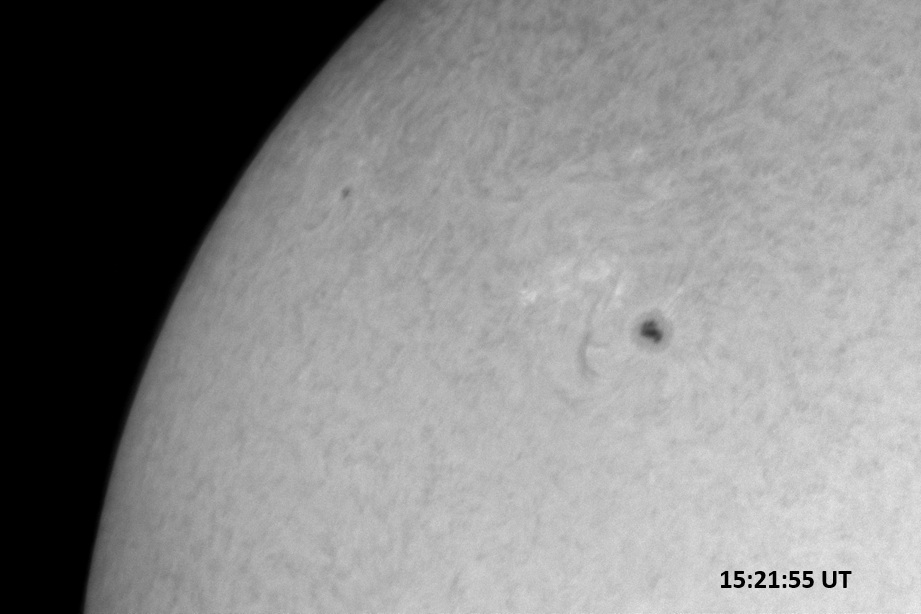
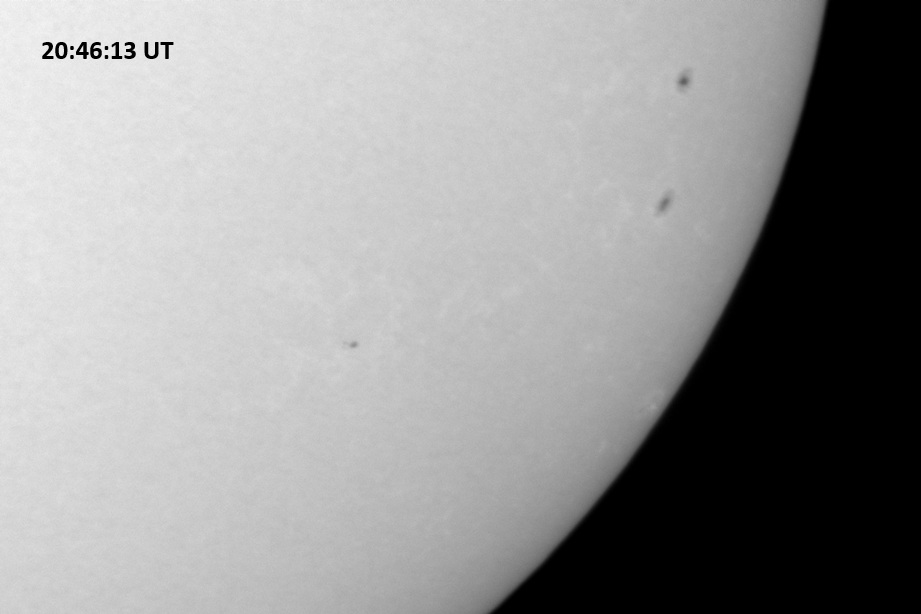
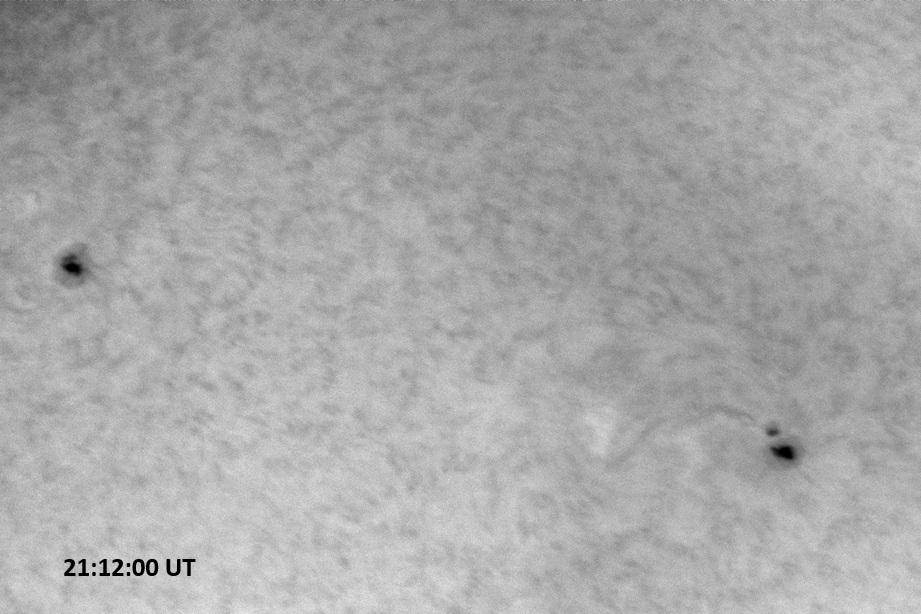
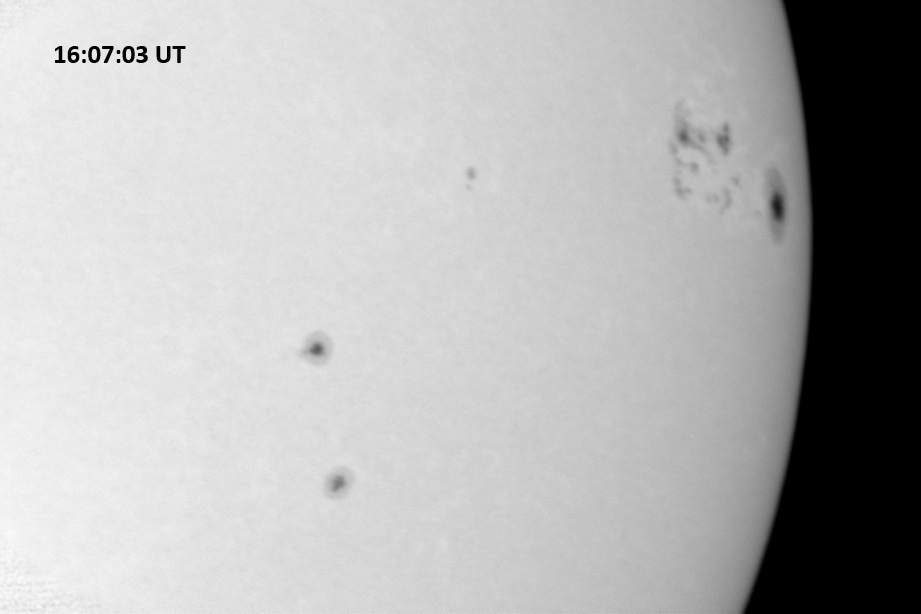
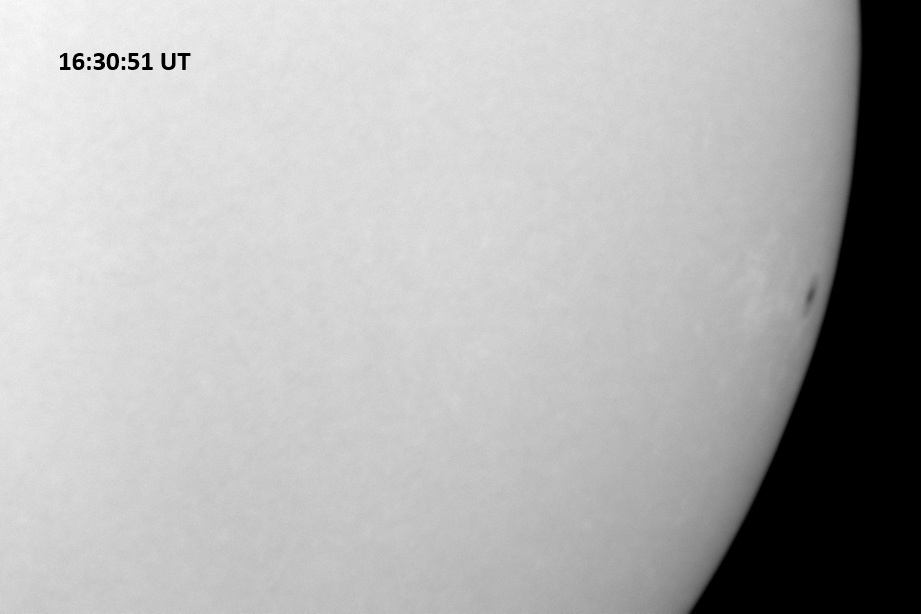
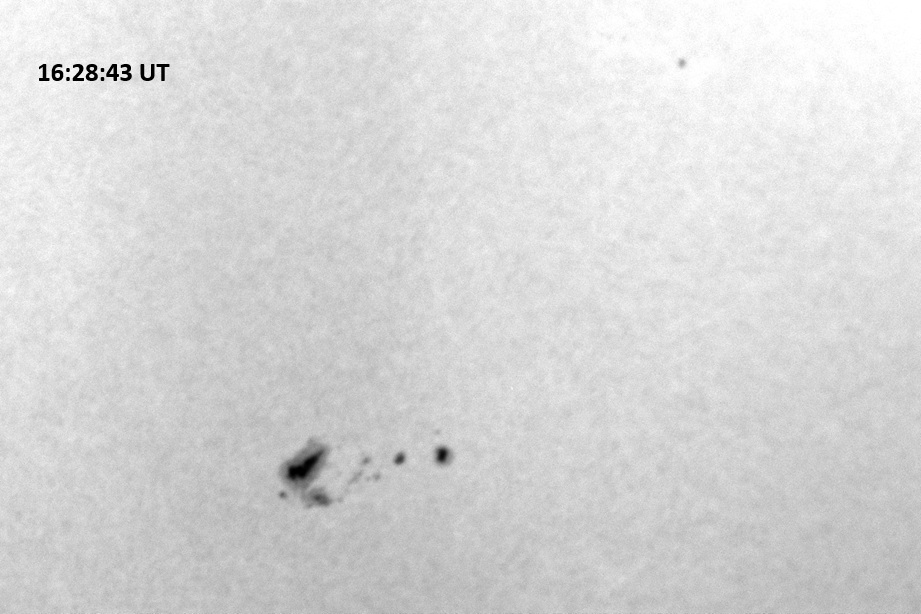
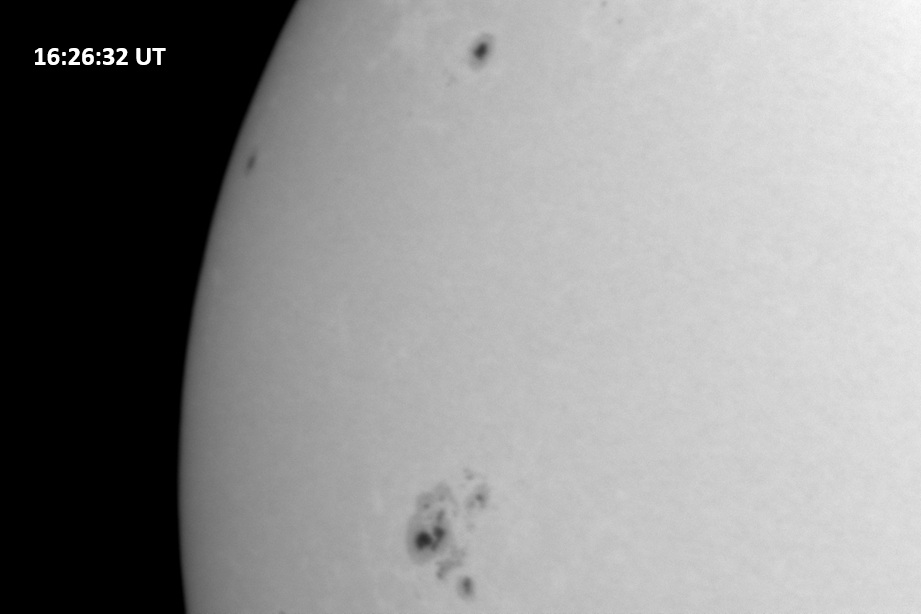
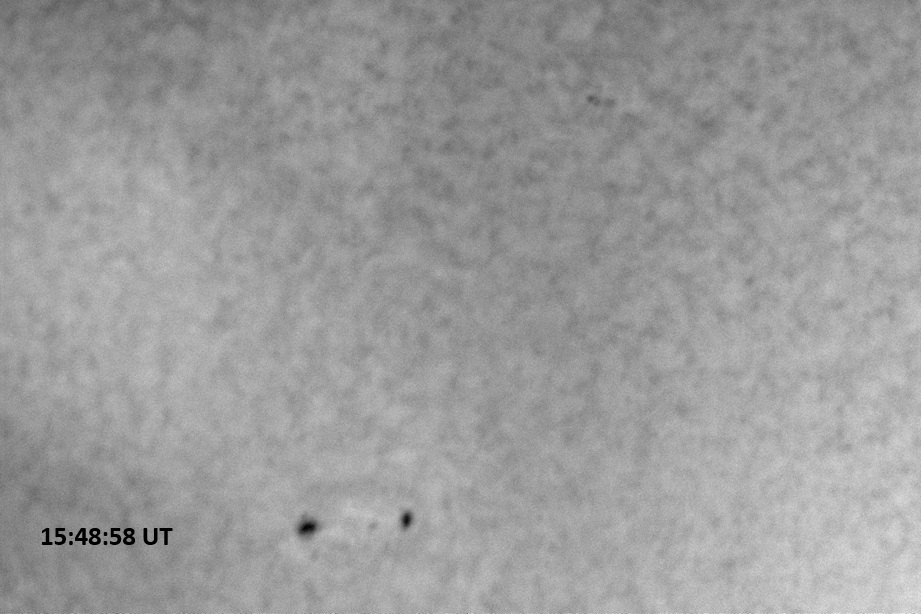
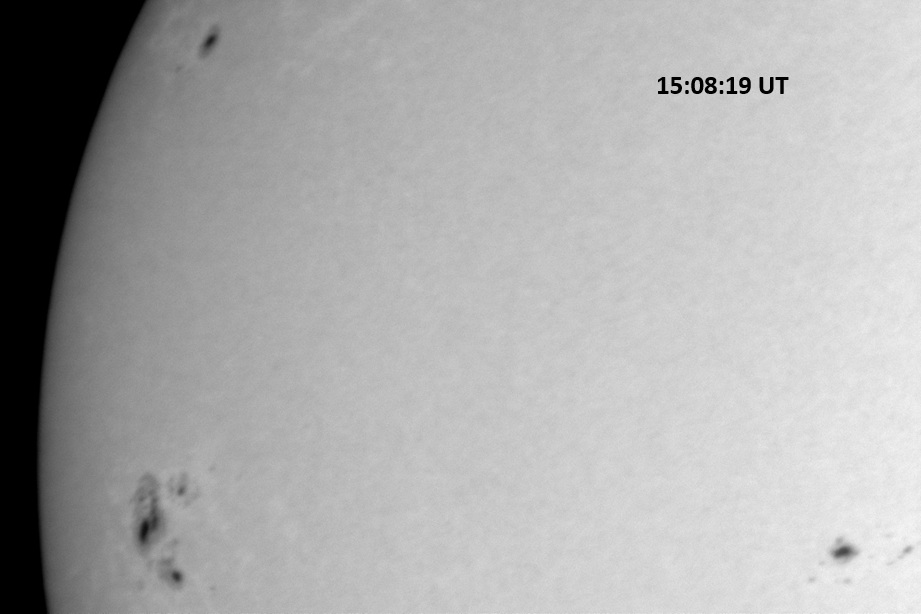
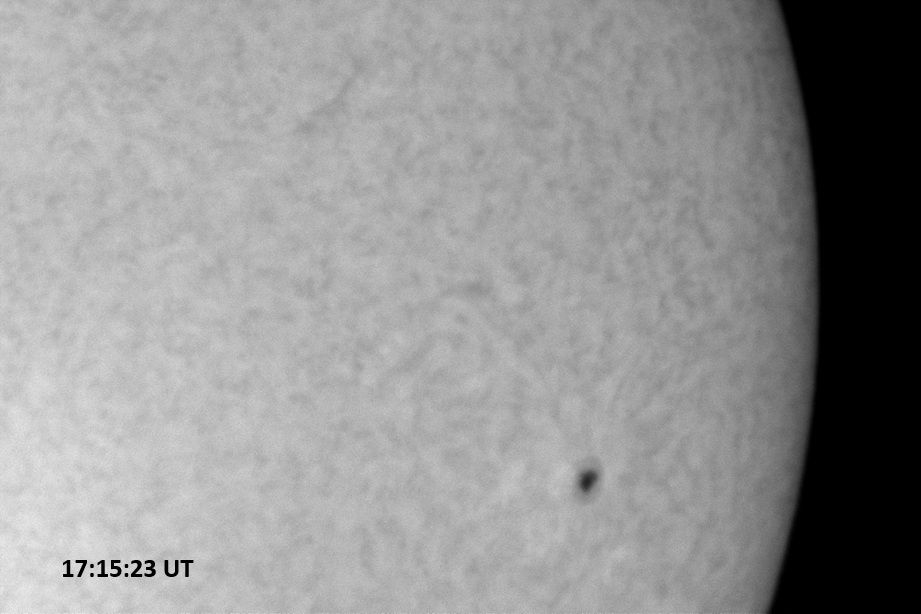
Observations were again made under less-than-ideal conditions, with abundant cumulus cloud, persistent equipment problems, and limited observing time. We were not able to obtain H-alpha images, only white light images due to these factors. Each of the below images cover 7.8’x11.4′ on the sky, are 0.09 second exposures, and are set so that celestial north is up, west is right.
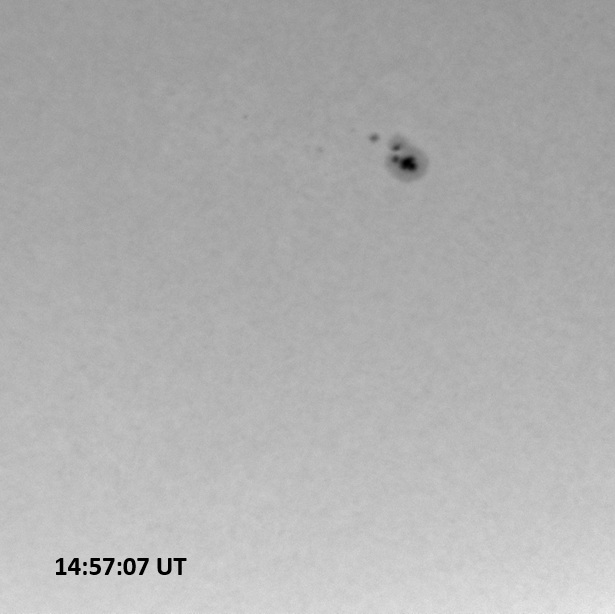
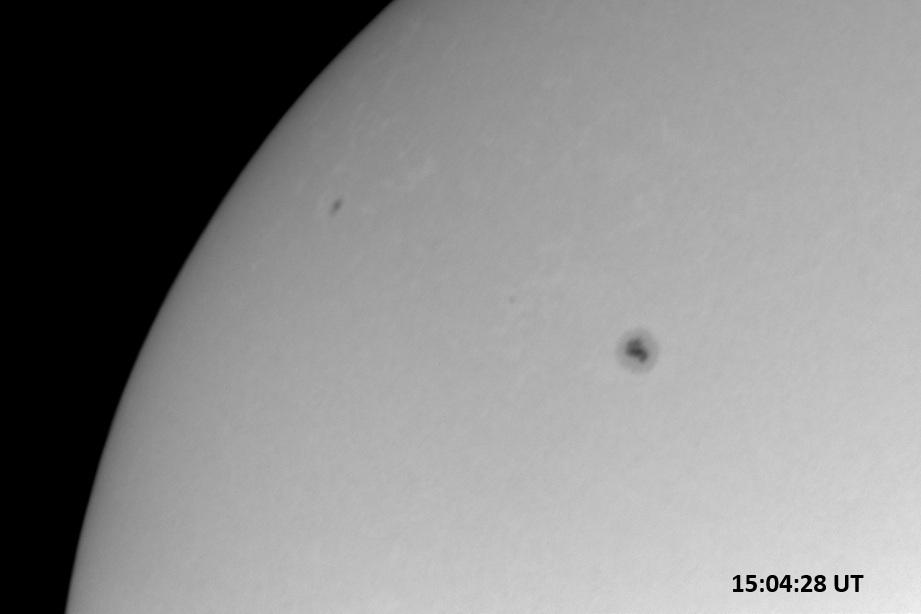
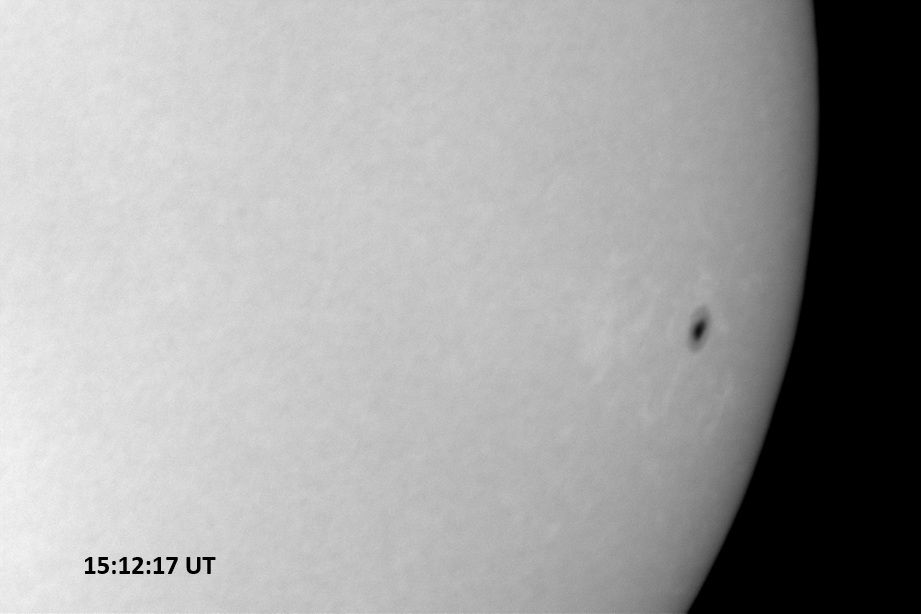
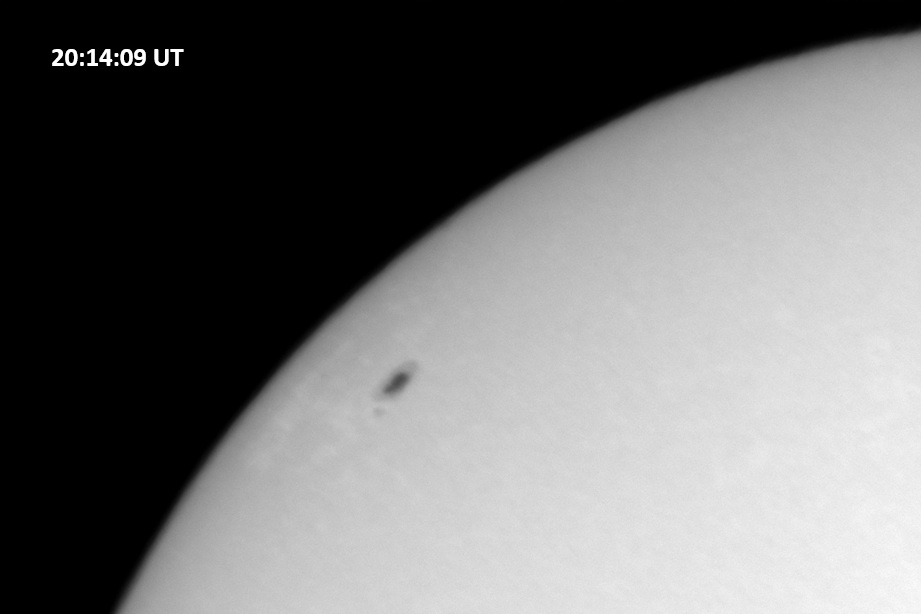 AR 14378 is the lone spot in the above image. It may be the leftover of AR 14366, which graced the Sun’s disk during the last rotation. AR 14378 is the lone spot in the above image. It may be the leftover of AR 14366, which graced the Sun’s disk during the last rotation. |
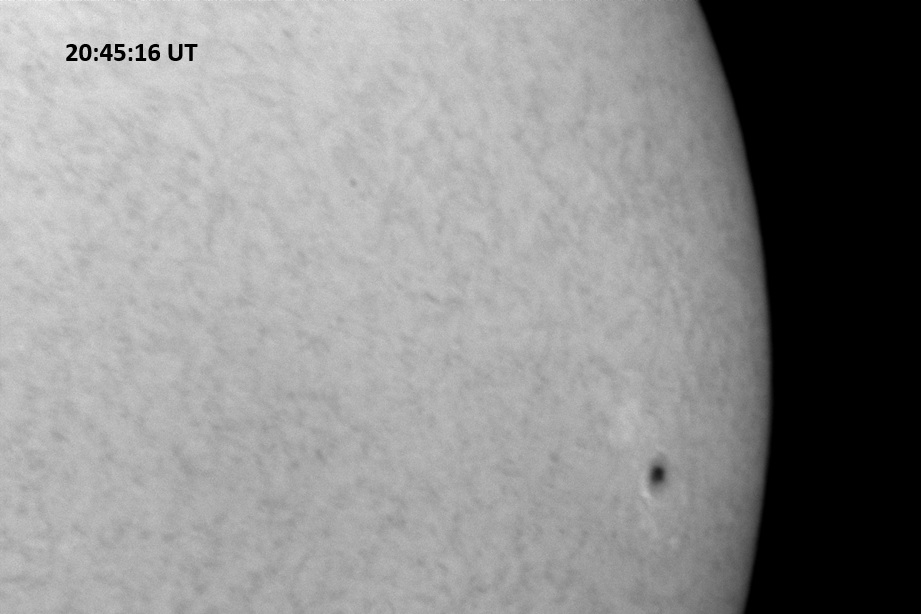
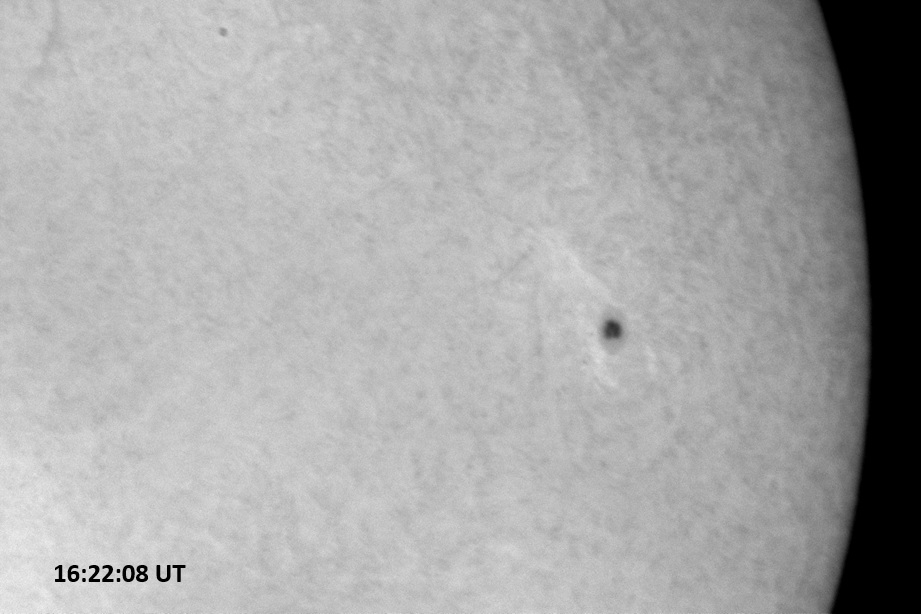
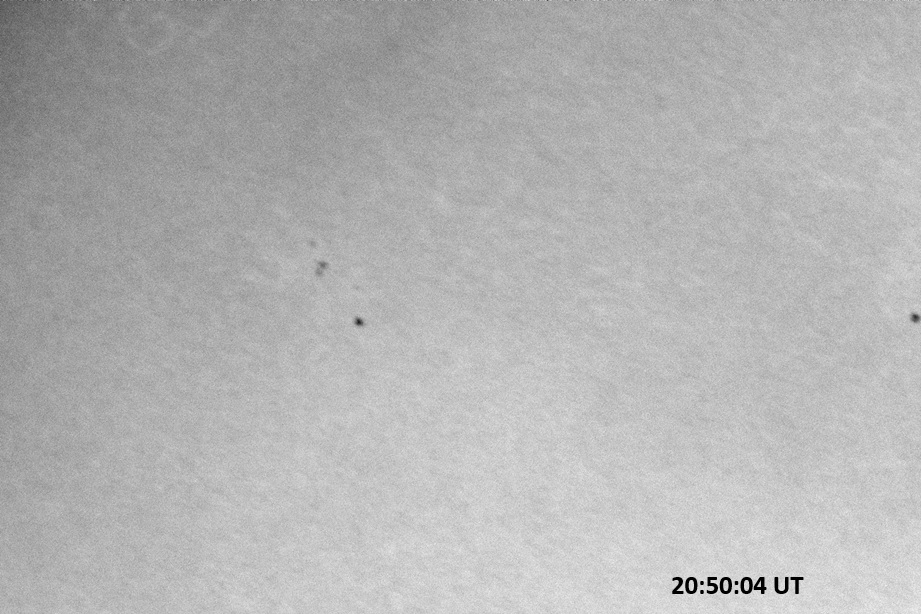
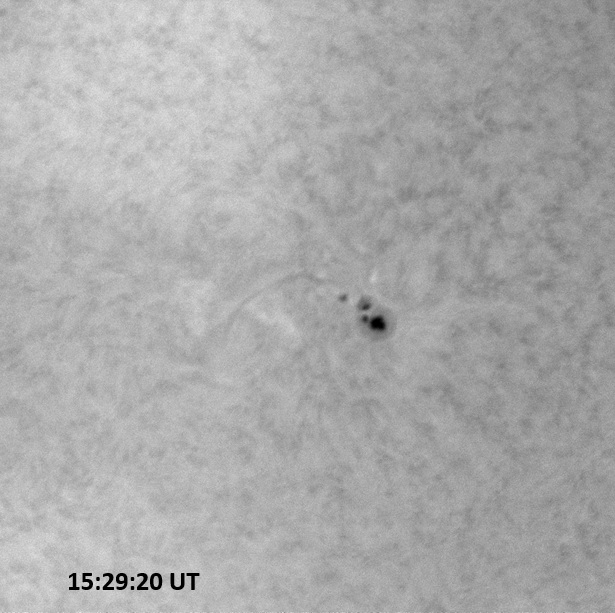
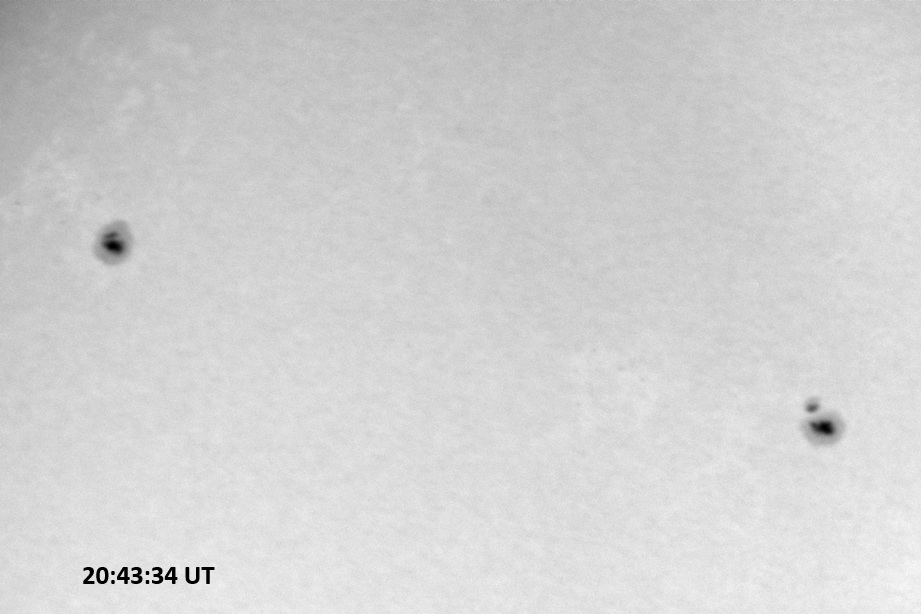
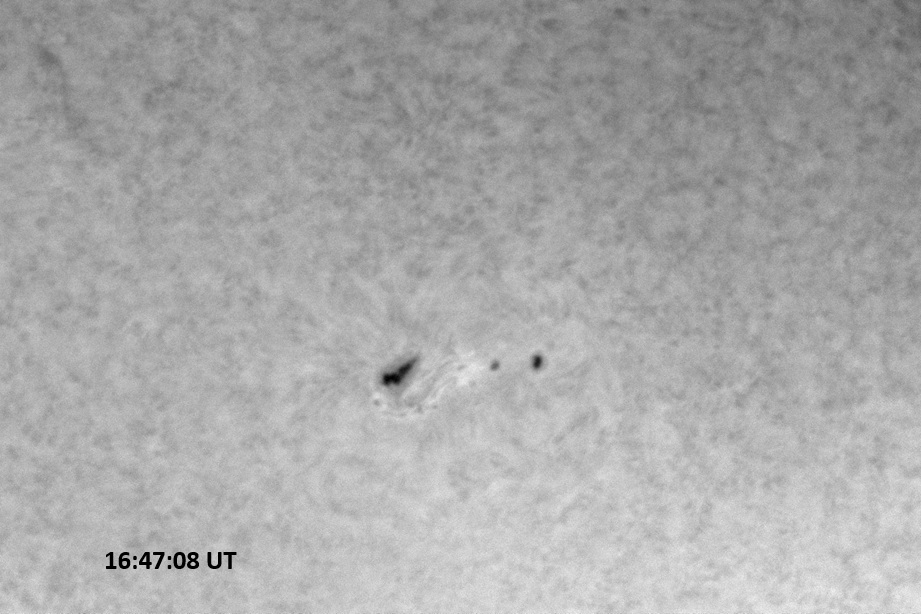
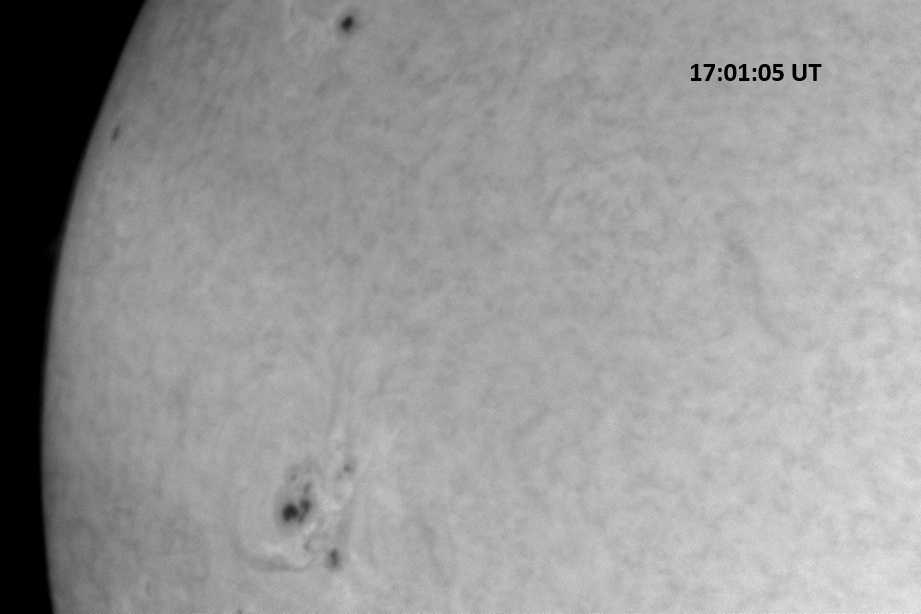
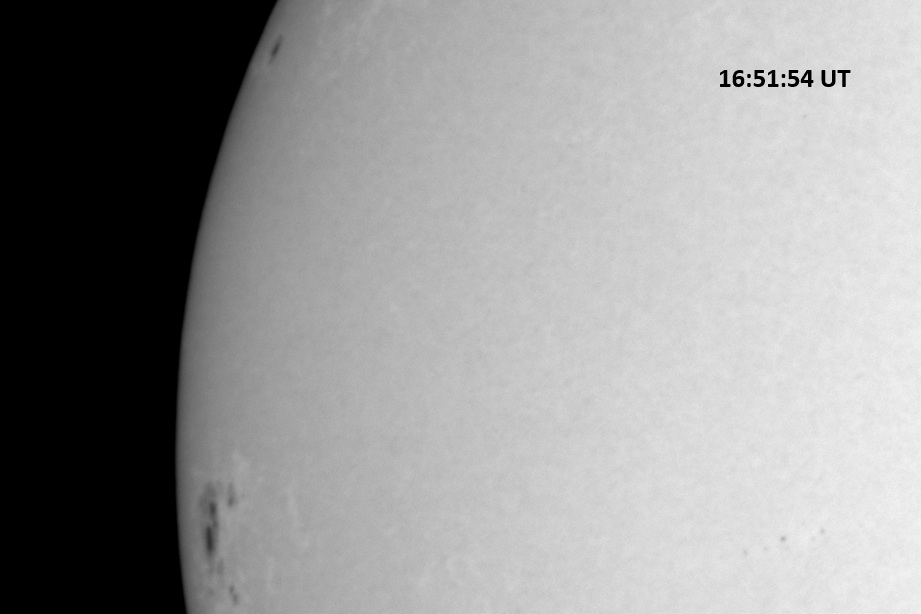
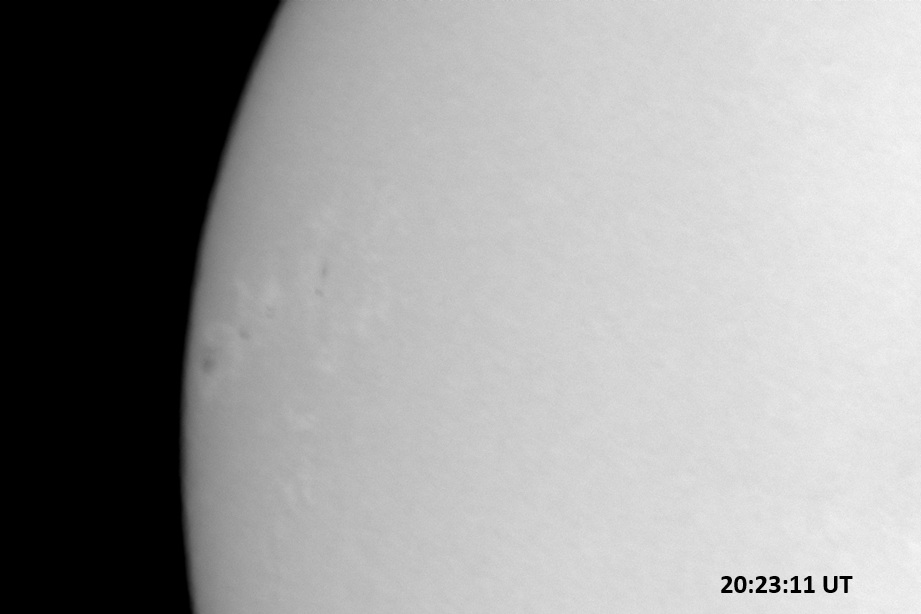 A string of spots is visible in this image. The leading pair, oriented vertically, is AR 14379. The remaining spots closer to the limb make up AR 14380. A string of spots is visible in this image. The leading pair, oriented vertically, is AR 14379. The remaining spots closer to the limb make up AR 14380. |
Solar activity is expected to be at low levels through 1 March with a chance for isolated M-class flare activity.
This will be the last posting as the observation program shuts down due to equipment issues and needed upgrades.
February 24, 2026
Solar activity was very low all day yesterday, with the background X-ray flux “flatlining” to as low as B2.9 level. It has since returned to low levels with a C1.0 flare today (24 February) at 7:33 UT, from an active region just beyond the SE limb, near latitude S21. The Sun returned to spotless today but some signs of change in the solar activity has been presenting itself, with a steadily increasing X-ray flux background. Since 7:33 UT, there had been a series of undulations taking on the form of five broad peaks and 9 shorter peaks in the C-class range of the X-ray flux plot. One peaked at C2.9 at 13:02UT; another at C4.5 (the largest of today so far, through 23:35 UT) at 17:12; and a series of 3 shorter peaks with the first one at 18:49 at C3.5. The X-ray background has been steadily decreasing since, but it has stayed above the C1.0 level all day.
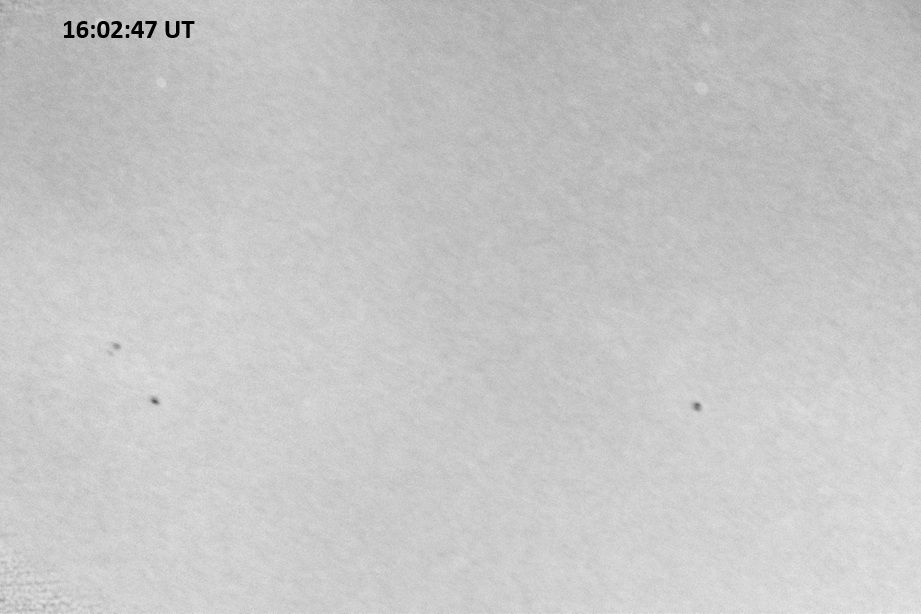
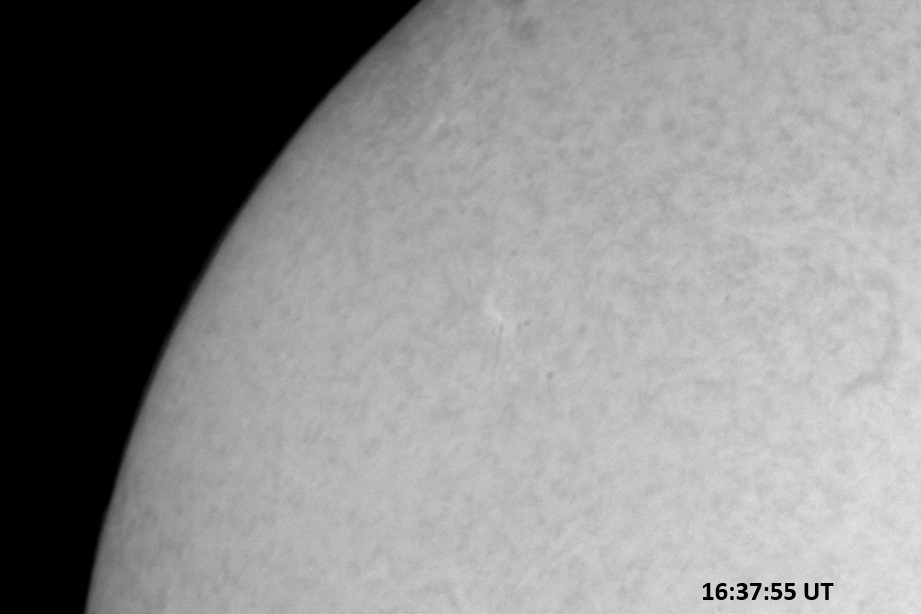
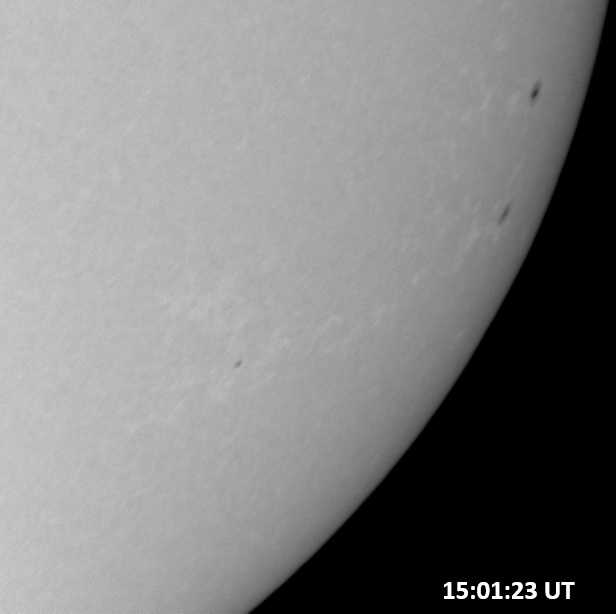
The first column below includes red continuum images, each 0.09 sec exposure; and the second column hosts H-alpha line center images, each 0.15 sec exposure. Each of the four images covers 7.8’x11.4′ on the sky. Celestial north is up, west is right in each image.
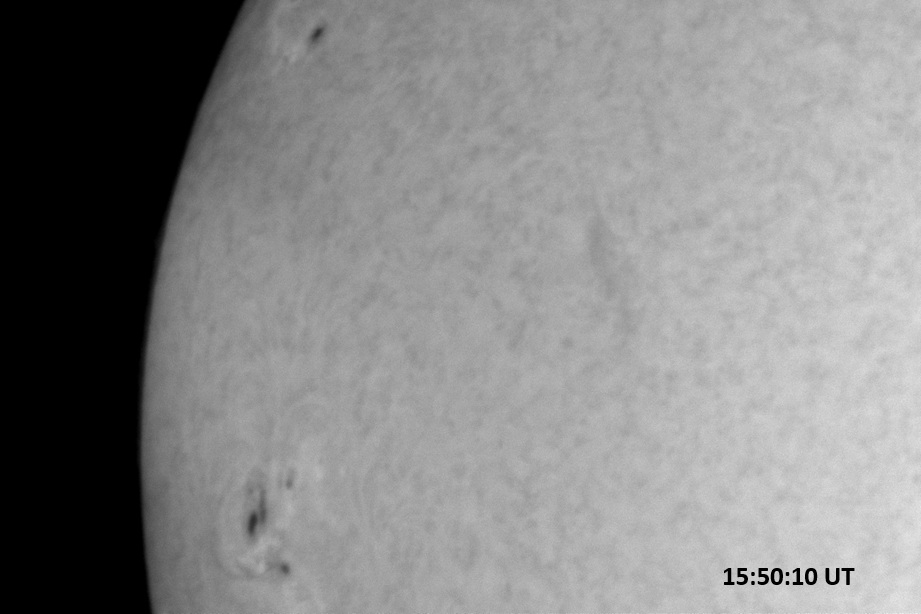
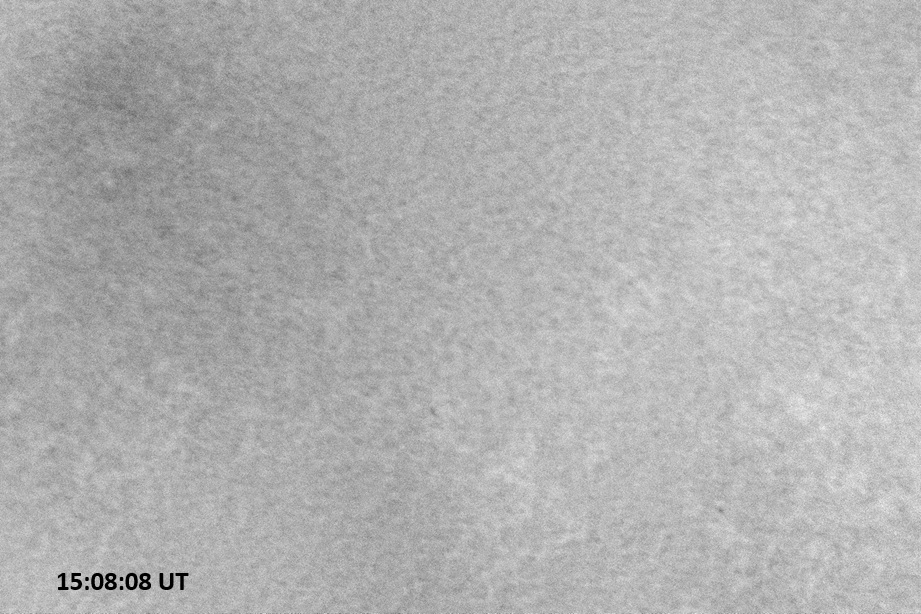 This frame is centered near the center of the solar disk, and only granulation is visible in this frame. There had been a small cluster of pores but they have since dissipated. This frame is centered near the center of the solar disk, and only granulation is visible in this frame. There had been a small cluster of pores but they have since dissipated. |
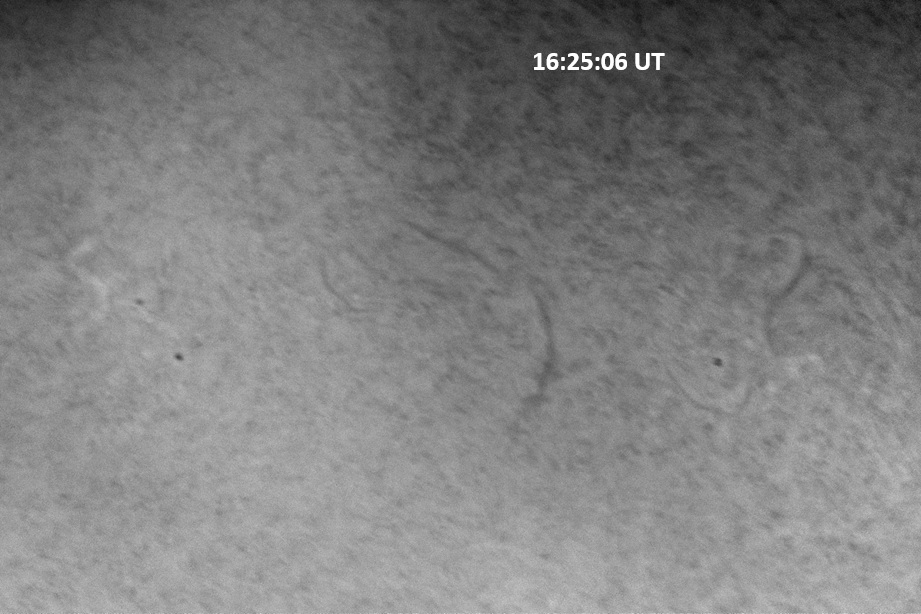
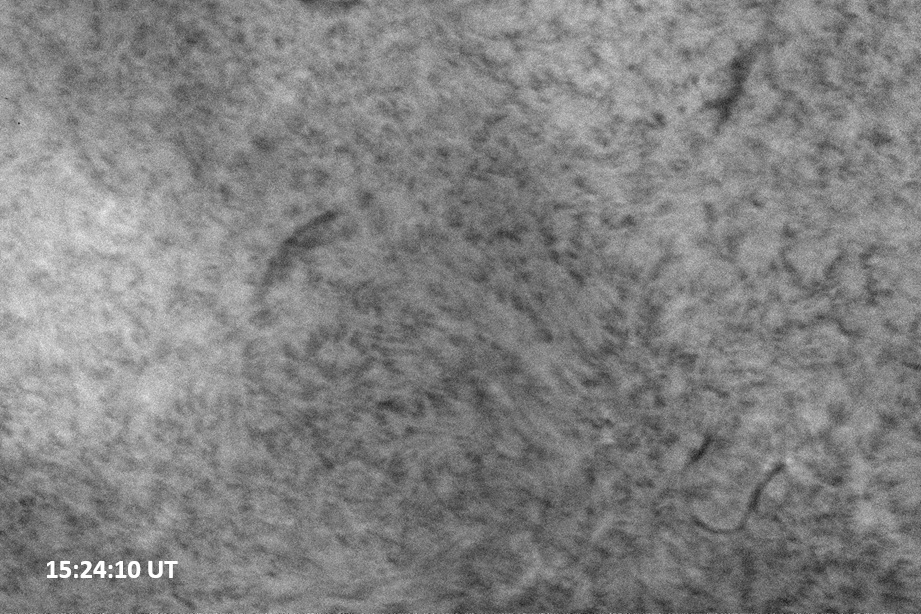 The same area of the Sun as depicted immediately left, reveals the overall H-alpha texture and several filaments. The bright patch along the left of the image is an artifact of the imaging system setup. The same area of the Sun as depicted immediately left, reveals the overall H-alpha texture and several filaments. The bright patch along the left of the image is an artifact of the imaging system setup. |
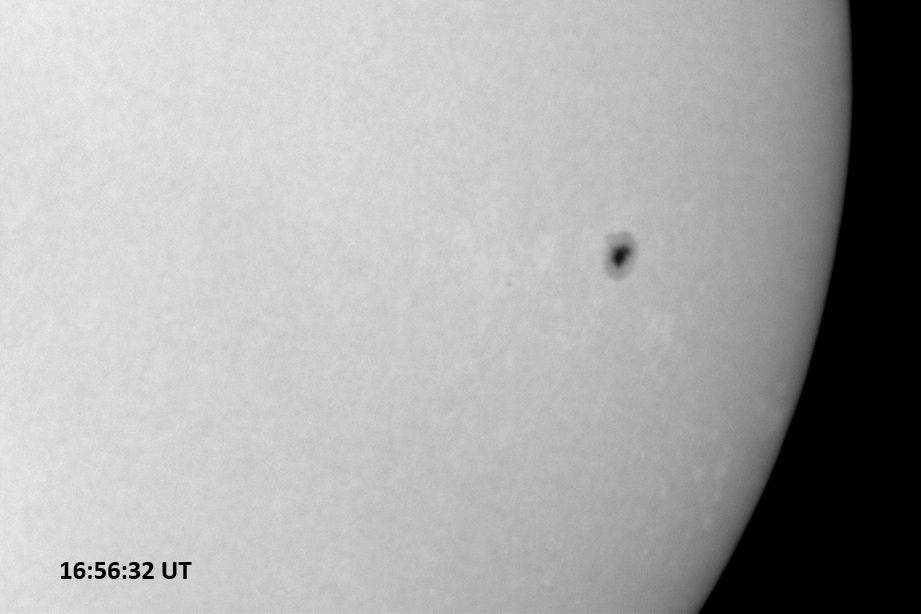
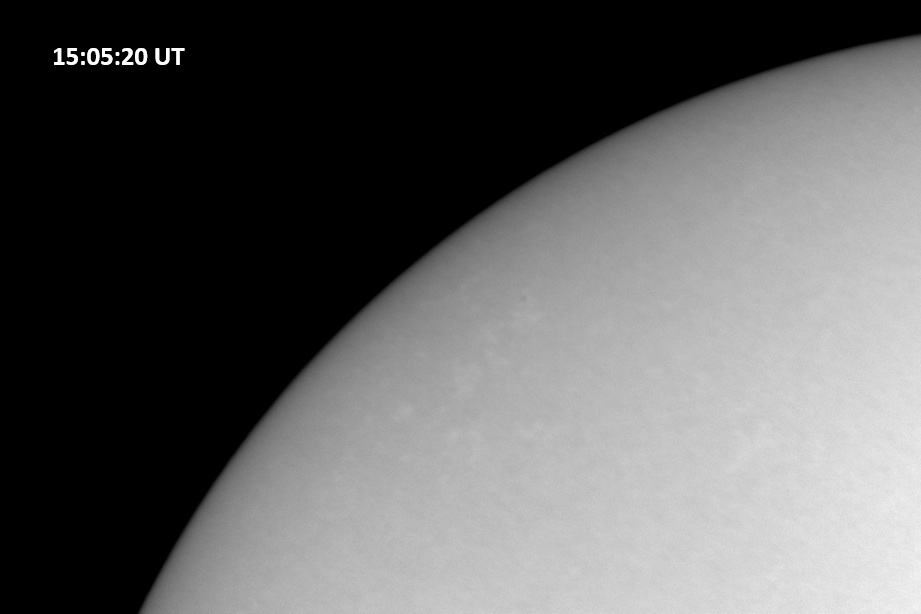 The ENE limb of the Sun shows possibly a pore along with several faculae (bright patches). The ENE limb of the Sun shows possibly a pore along with several faculae (bright patches). |
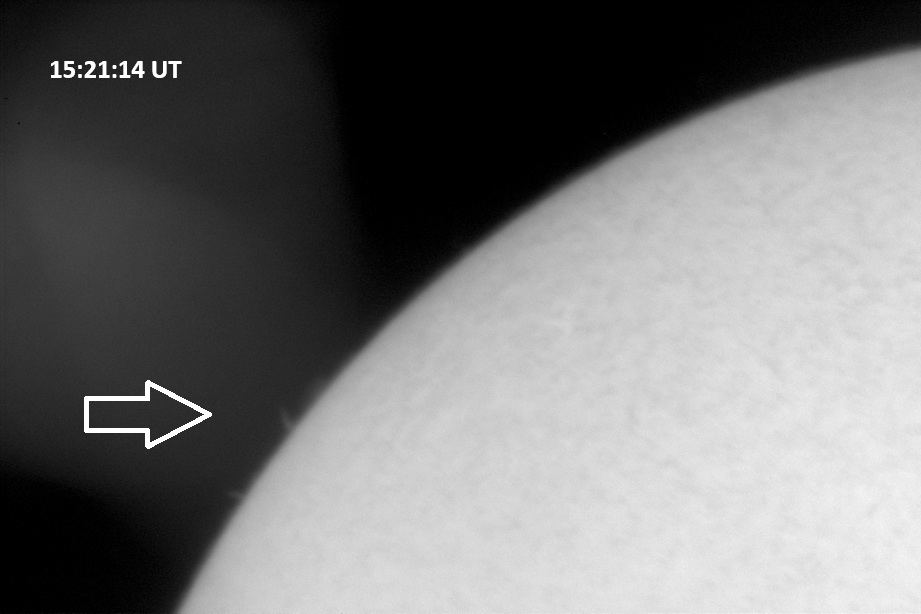 The arrow points to some limb activity in H-alpha that may be heralding the return of AR 14366. The bright patch is internal system reflection of H-alpha light. The arrow points to some limb activity in H-alpha that may be heralding the return of AR 14366. The bright patch is internal system reflection of H-alpha light. |
Solar activity is expected to be very low, with a chance for C-class flares and a very slight chance (1%) for an M-class flare through 26 February.
February 23, 2026
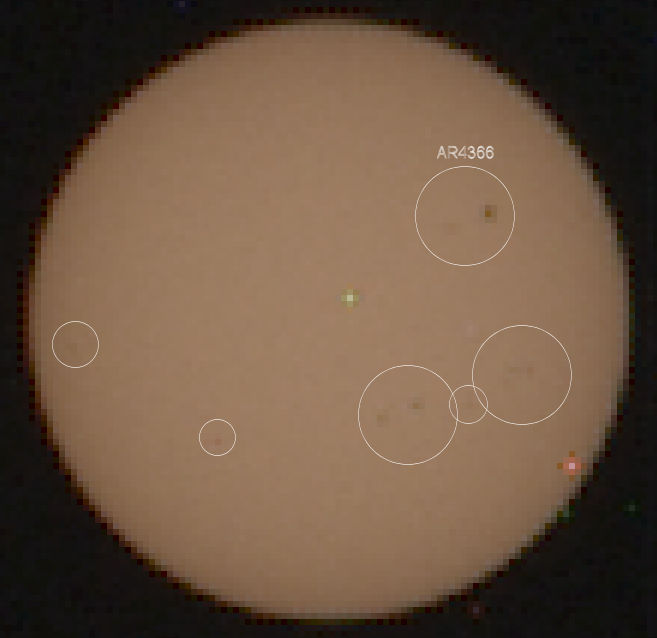
Solar activity continues to be at low levels as the Sun becomes spotless. That feat was actually achieved yesterday when the disk was virtually spotless. However, there were four low-level C-class flares yesterday. One was a long-duration C1.5 flare at 16:41 UTC on 22 February from an active region over the WSW limb. A 15 degree long prominence erupted off the SE limb at about 15:30 UTC on 22 February. The active regions that were expected to rotate into view by the end of last week never materialized. However, AR 14366 is expected to return in the next several days. It had been monitored (along with five additional much smaller spot groups) by the Mars Perseverance rover as the spot group crossed the far side of the Sun. Mars and the rover are on the far side of the Sun as seen from Earth. The below image, from spaceweather.com and NASA from 19 February.
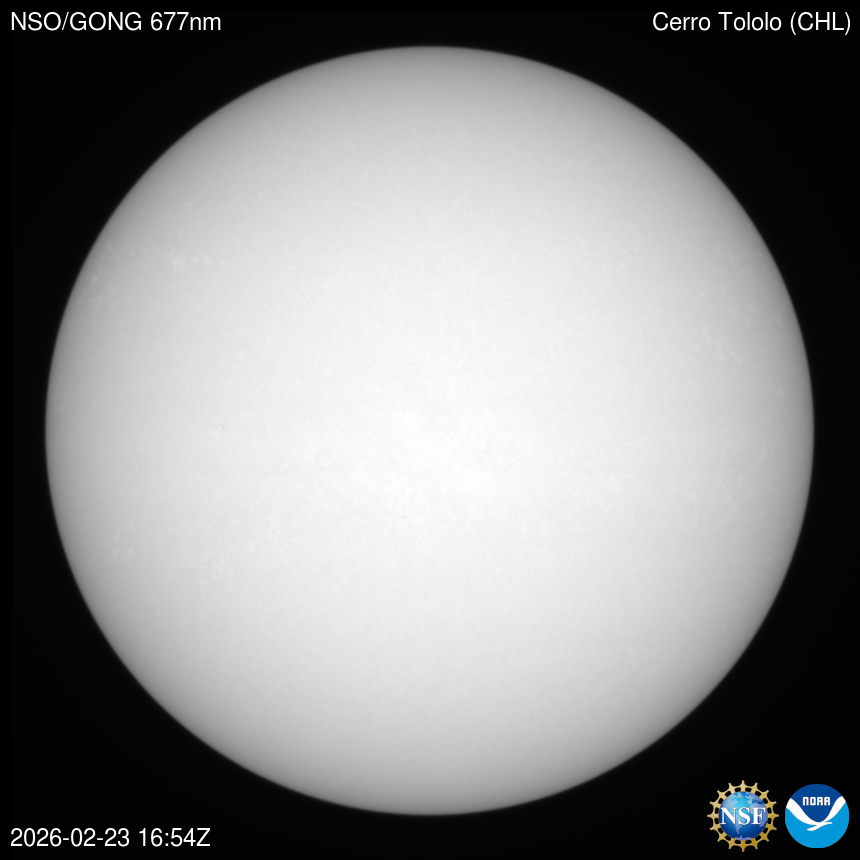
Meanwhile today’s “nearside” solar image from the GONG (Global Oscillation Network Group) network of solar observatories reveals a much different picture:
Solar activity is expected to be very low, with a chance for C-class flares and a slight chance for an M-class flare, through 25 February.
February 19, 2026
Solar activity continues to be at low levels as the Sun becomes more spotless. There are only three spotted active regions on the visible solar disk, a larger spot and two small spot groups. An unnumbered region of plage produced a C2.1 flare at 20:42 UT, mentioned below on 18 February. Another unnumbered plage region produced a C2.0 flare from near N20W48 (the northwest quadrant). AR 14374 produced a C1.0 at 10:15 UT today, 19 February. AR 14374 is simplifying some as is AR 14377; AR 14375 remained stable. A filament disappeared in the northwest quadrant of the solar disk at approximately 21:00 UT on 18 February. Most of the material likely fell back to the solar surface.
Observations were again made under less-than-ideal conditions, with haze, abundant cumulus cloud, and limited observing time. Exposures were lengthened due to the presence of haze. The first column below includes red continuum images, each 0.15 sec exposure; and the second column hosts H-alpha line center images, each 0.25 sec exposure. Each of the four images covers 7.8’x11.4′ on the sky. Celestial north is up, west is right in each image.
 AR 14375 (top center) and 14374 (right). AR 14375 (top center) and 14374 (right). |
 AR 14374 has produced an occasional low level C-class flare but has been quiet. AR 14374 has produced an occasional low level C-class flare but has been quiet. |
 AR 14377 continues to be small and simple. AR 14377 continues to be small and simple. |
 AR 14377 almost disappears in this image, which features a few small filaments. AR 14377 almost disappears in this image, which features a few small filaments. |
Solar activity is expected to be low, with a slight chance for an M-class flare, through 22 February.
February 18, 2026
Solar activity remains at low levels. The strongest event, both yesterday and today (through 21:55 UT 18 February) was a long duration C2.2 flare peaking at 20:42 UT from an unnumbered region near S07 E61. AR 14374 produced a C1.8 flare at 23:23 UT, 17 February; and a C1.4 flare at 0:50 UT on 18 February. An unnumbered region (possibly the source of today’s C2) produced a C1.1 flare from near S05 E85. AR 14374 is slowly decaying, and AR 14373 has rotated over the western limb. There are a total of three spotted regions currently, AR 14374, 14375, and 14377. The latter two were mostly unchanged from yesterday.
Another large filament erupted from beyond the southwestern limb starting at about 4:08 UT on 18 February. This produced a CME that will miss Earth. This is likely the same filament that graced the southern part of the solar disk last week.
Observations were again made under less-than-ideal conditions. Exposures were lengthened due to the presence of high cirrus clouds. The first column below includes red continuum images, each 0.15 sec exposure; and the second column hosts H-alpha line center images, each 0.25 sec exposure. Each of the four images covers 7.8’x11.4′ on the sky. Celestial north is up, west is right in each image.
 AR 14374 starts to approach the western limb. It is the largest spot currently visible on the Sun. AR 14374 starts to approach the western limb. It is the largest spot currently visible on the Sun. |
 AR 14374 had produced an occasional C-class flare but this part of the Sun has been quiet overall. AR 14374 had produced an occasional C-class flare but this part of the Sun has been quiet overall. |
 AR 14377 (left) and 14375 (right) continue to persist on the solar disk. AR 14377 (left) and 14375 (right) continue to persist on the solar disk. |
 AR 14377 and 14375, along with a lengthening filament, are visible in the above image. AR 14377 and 14375, along with a lengthening filament, are visible in the above image. |
Solar activity is expected to be low, with a slight chance for an M-class flare, through 20 February.
February 17, 2026
Solar activity was very low to low. A filament erupted and generated a C1.0 flare from an unnumbered region just behind the SE limb of the Sun. AR 14374 has grown slightly, with the rest of the sunspot groups (three in total, including 14374) remaining stable. A filament just south of disk-center began to erupt yesterday (16 February) around 12:30 UT. This produced a very faint CME that continued off the northeast limb.
Observations were made under less-than-ideal conditions. Exposures were lengthened due to the presence of high cirrus clouds. The first column below includes red continuum images, each 0.15 sec exposure; and the second column hosts H-alpha line center images, each 0.25 sec exposure.Each of the four images covers 7.8’x11.4′ on the sky. Celestial north is up, west is right in each image.
 AR 14373 (top center) and 14373 (lower right on Sun’s edge). AR 14373 (top center) and 14373 (lower right on Sun’s edge). |
 AR 14374 has been quiet all day today, as has this zone of the Sun. AR 14374 has been quiet all day today, as has this zone of the Sun. |
 AR 14377 (left of center) and 14375 (right, on edge of frame), two tiny spot groups. AR 14377 (left of center) and 14375 (right, on edge of frame), two tiny spot groups. |
 AR 14377 is marked by bright plage (left) and a filament (just right of image center) is visible in this region of the Sun. AR 14377 is marked by bright plage (left) and a filament (just right of image center) is visible in this region of the Sun. |
Solar activity is expected to be low through 18 February with a slight chance of an M-class flare.
February 16, 2026
Solar activity reached moderate levels early today after an M2.4 flare that peaked at 4:35 UTC today (16 February). This came from an active region over the east limb and much of its energy was blocked by the Sun. This region will rotate into view sometime later this week. After this event, solar activity dropped to very low levels with only a C1.0 at 13:06 and an optical sub-flare from AR 14374 at 15:36. All five visible active regions were stable.
The first column below includes red continuum images, each 0.09 sec exposure; and the second column hosts H-alpha line center images, each 0.15 sec exposure. Each of the four images covers 7.8’x11.4′ on the sky. Celestial north is up, west is right in each image.
 AR 14374 (upper left) and 14373 (lower right) are the two largest spot groups on the visible solar disk. AR 14374 (upper left) and 14373 (lower right) are the two largest spot groups on the visible solar disk. |
 Small localized brightenings were observed next to each of these regions during today’s observations, but were not recorded as sub-flare events by NOAA. Small localized brightenings were observed next to each of these regions during today’s observations, but were not recorded as sub-flare events by NOAA. |
 This nearly blank region of the Sun contains two small spotted groups: AR 14377 near image center, and 14376 (single spot) above and right of it. This nearly blank region of the Sun contains two small spotted groups: AR 14377 near image center, and 14376 (single spot) above and right of it. |
 This zone of the Sun hides the two tiny spot groups in H-alpha texture, but AR 14377 shows as a bright spot This zone of the Sun hides the two tiny spot groups in H-alpha texture, but AR 14377 shows as a bright spot |
Solar activity is expected to be low through 18 February with a slight chance of an M-class flare.
February 12, 2026
Solar activity continued at moderate levels through early today with two M1.4 flares: one at 13:12 UT on 11 February, and the second at 2:40 UT today, 12 February, from newly-departed AR 14366. This region was the source of six C-class flares. Since the second M1.4 flare, solar activity returned to low levels, with the background X-ray levels steadily sloping downward as AR 14366 rotates further beyond the west limb. AR 14373 has shown some modest growth and additional sunspots; ARs 14369 and 14371 showed some minor decay. The rest of the regions were unchanged.
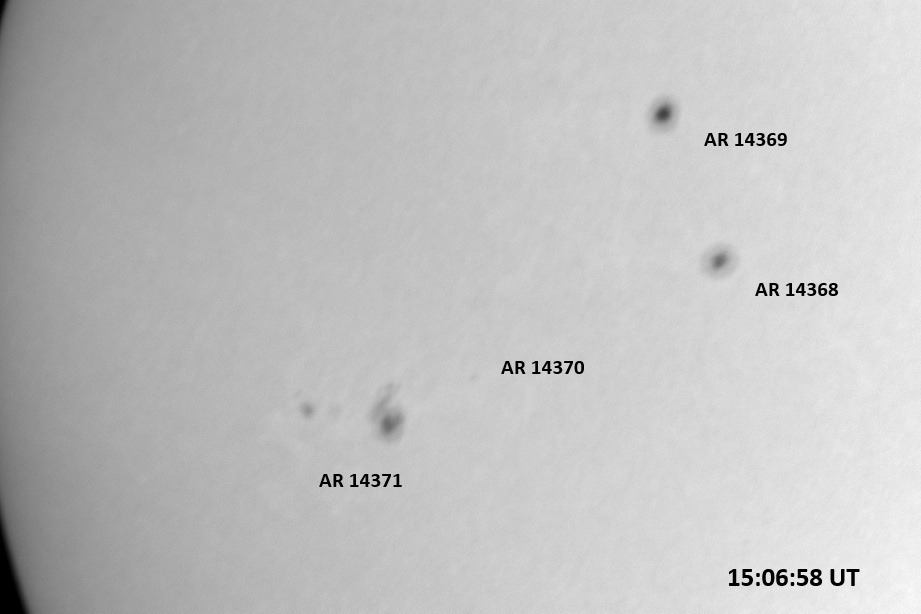
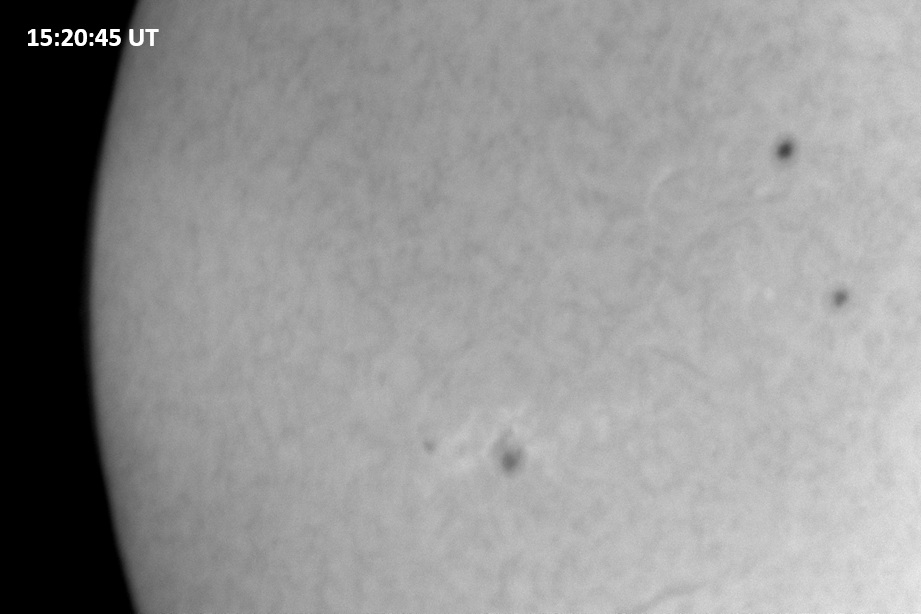
The first column below includes red continuum images, each 0.09 sec exposure; and the second column hosts H-alpha line center images, each 0.15 sec exposure. Each of the images covers 7.8’x7.8′ on the sky, unless indicated otherwise. Celestial north is up, west is right in each image.
 The AR 14369/14368 pair (upper right) is about to rotate out of view. The AR 14369/14368 pair (upper right) is about to rotate out of view. |
 This zone of the Sun has been quiet. This zone of the Sun has been quiet. |
 AR 14373 (above) is the only spot group in a large “sea” of featureless solar disk. AR 14373 (above) is the only spot group in a large “sea” of featureless solar disk. |
 AR 14373 has remained quiet all day. AR 14373 has remained quiet all day. |
 This 7.8’x11.4′ image depicts AR 14374 (right of image center) and 14375 (upper left) as they rotate into better view. This 7.8’x11.4′ image depicts AR 14374 (right of image center) and 14375 (upper left) as they rotate into better view. |
 This 7.8’x11.4′ image shows the same view as at left, but in H-alpha. This zone of the Sun remains quiet as well. This 7.8’x11.4′ image shows the same view as at left, but in H-alpha. This zone of the Sun remains quiet as well. |
Solar activity is expected to be low, with a slight chance for M-class flares through 14 February.
February 11, 2026
Solar activity remained at moderate levels today. The largest was an M1.2 at 13:12 UT today from AR 14366. This region also produced a long duration, double-peaked M1.1 event, first peak at 0:44 UT. AR 14366 also produced eight C-class flares yesterday and today. AR 14366 has rotated over the west limb of the Sun and it was not visible either visually or in images taken this afternoon. Some modest limb activity in H-alpha marked the location of the region just over the solar limb. AR 14371 , 14373, and 14374 each produced C-class flares yesterday into this afternoon. AR 14371 and 14369 are in decay, with the other numbered active regions remaining stable. There is another region (AR 14375) that rotated into view behind AR 14374, but this was quiet.
A large filament in the northwest quadrant of the solar disk lifted off and disappeared around 19:10 UT on 10 February. There was possibly another eruption from the west southwest limb of the Sun, seen around 19:24 UT and superimposed on the eruption from the filament. It is yet to be determined if all this has generated a coronal mass ejection.
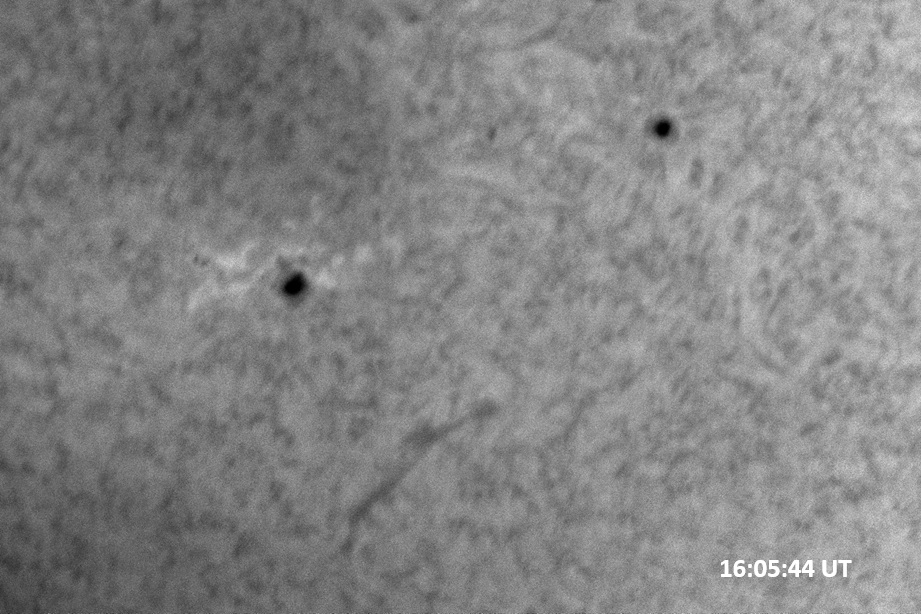
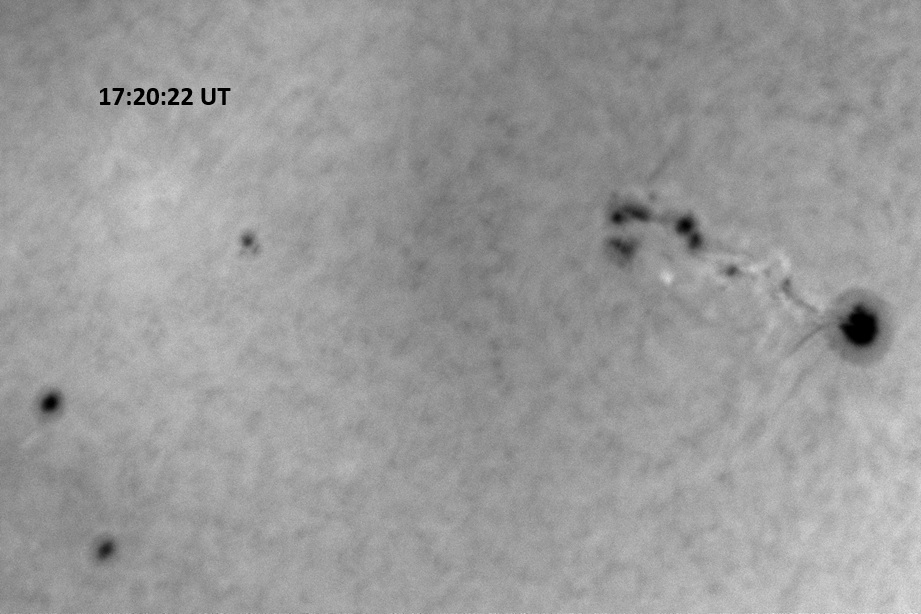
The first column below includes red continuum images, each 0.09 sec exposure; and the second column hosts H-alpha line center images, each 0.15 sec exposure. Each of the four images covers 7.8’x11.4′ on the sky. Celestial north is up, west is right in each image.
 AR 14369 (upper most right), 14368 (upper right) and 14371 (just below and left of image center) appear modest in this view. AR 14369 (upper most right), 14368 (upper right) and 14371 (just below and left of image center) appear modest in this view. |
 This zone of the Sun had been mostly quiet, except for an occasional C-class flare from AR 14371. This zone of the Sun had been mostly quiet, except for an occasional C-class flare from AR 14371. |
 AR 14374 (upper left) and 14373 (lower right) appear rather simple in this view. AR 14374 (upper left) and 14373 (lower right) appear rather simple in this view. |
 Each of these regions have produced low-level C-class flares today and yesterday. Each of these regions have produced low-level C-class flares today and yesterday. |
Solar activity is expected to be low through 13 February. There remains a slight chance (10-15%) for an M-class and/or X-class flaring from over the western limb by AR 14366.
February 9, 2026
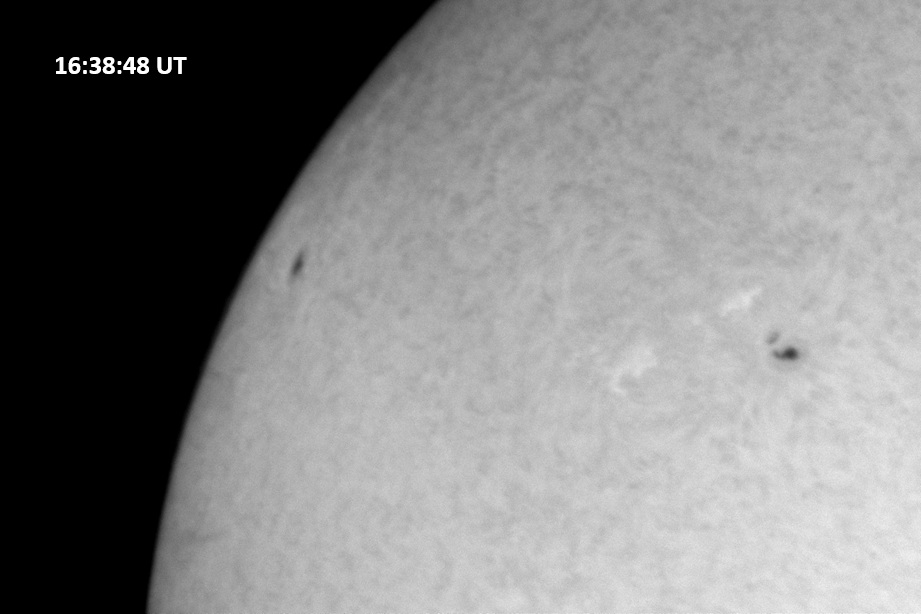
Solar activity reached moderate levels yesterday and early today, before returning to low levels all day today. AR 14366 produced two M-class flares, the largest of which was an M2.8 at 2:27 UT today (9 February). The region continues to be the largest, most magnetically complex on the visible solar disk, but it is approaching the western limb. It has also been on a slow decay. AR 14374 rotated into view and produced a C6.6 flare at 8:36 UT on the 9th. This, and the other active regions on the solar disk were largely stable. AR 14366, beside the M2.8 today, produced 6 C-class flares, the most recent of which occurred at 15:36 UT. Then it went quiet for the rest of the day (through 23:15 UT). AR 14374 produced another C-class flare, a C3.0 at 18:17 UT today.
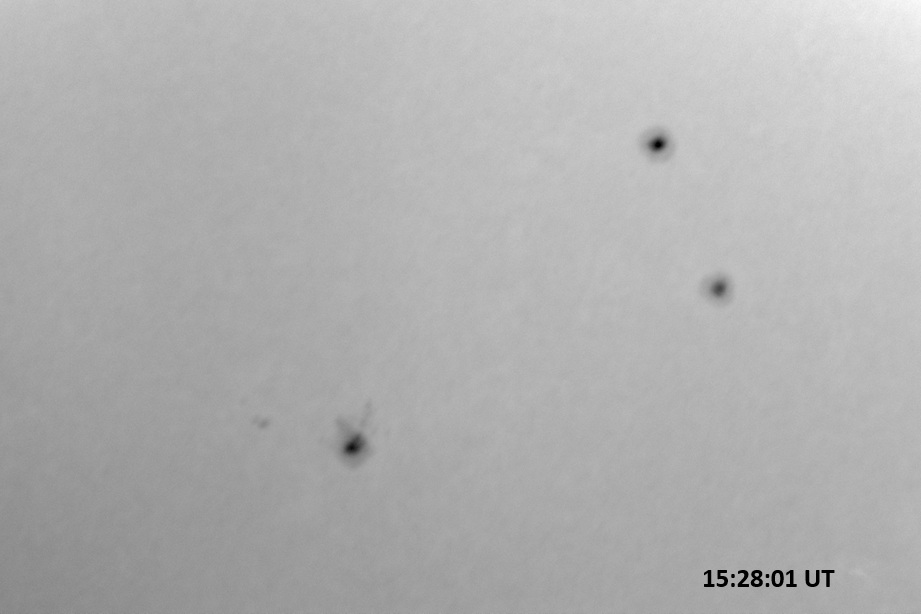
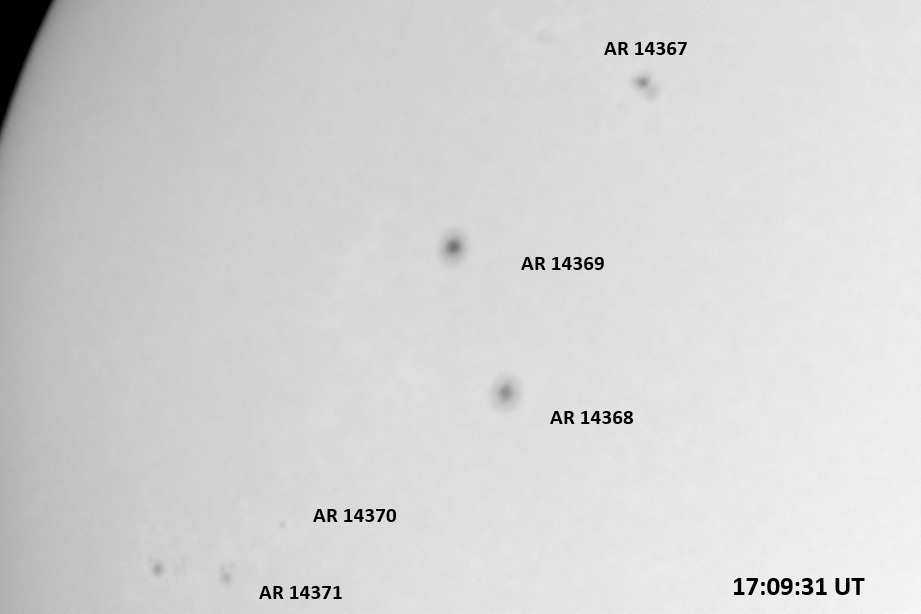
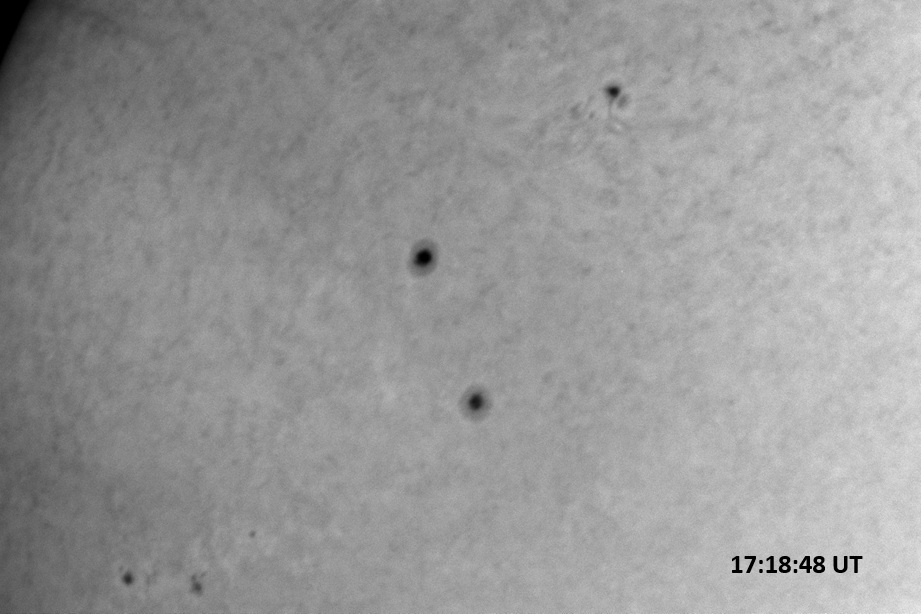
The first column below includes red continuum images, each 0.09 sec exposure; and the second column hosts H-alpha line center images, each 0.15 sec exposure. Each of the four images covers 7.8’x11.4′ on the sky. Celestial north is up, west is right in each image.
 AR 14366 (right, near edge of Sun) prepares to rotate out of view. The remaining spots are (top to bottom) AR 14367, 14369, and 14368. AR 14366 (right, near edge of Sun) prepares to rotate out of view. The remaining spots are (top to bottom) AR 14367, 14369, and 14368. |
 This zone of the Sun, as well as the rest of the Sun, has been mainly quiet for the duration of our long observing session today. This zone of the Sun, as well as the rest of the Sun, has been mainly quiet for the duration of our long observing session today. |
 AR 14374 (left, near edge of Sun) and 14373 (right) are the only spotted regions on the eastern half of the solar disk. AR 14374 (left, near edge of Sun) and 14373 (right) are the only spotted regions on the eastern half of the solar disk. |
 AR 14374 (near the edge of the Sun) produced two C-class flares so far today. AR 14374 (near the edge of the Sun) produced two C-class flares so far today. |
Solar activity is expected to be moderate with M-class flares likely and a chance for an X-class flare from AR 14366 through 11 February.
February 6, 2026
Solar activity returned to low levels today. Since the last of a series of M-class flares (an M1.1 at 22:18 UT yesterday, 5 February, from AR 14272, which has decayed to plage), there has been no further M-class flare activity today, through 23:15 UT. The most powerful flare of yesterday was a long duration M2.7 at 4:41 UT on 5 February from AR 14366. This region continues to slowly decline in magnetic complexity and optical appearance and today’s activity level matches these observations. AR 14371, however, showed rapid growth and became more magnetically complex. AR 14362 has also grown some and together with AR 14371, was the source for most of the C- and M-class flares yesterday. Today, only C-class flares, mostly from AR 14366; the strongest was a C6.9 at 10:20 UT today, 6 February. All of the other visible spotted active regions (there are seven total) were stable or in decay.
A coronal mass ejection launched off the south/southwest limb at 15:48 UT on 5 February, likely from the M1.8/1N flare that was produced from AR 14362, which peaked at 15:13 UT on 5 February. We observed part of the tail end of this event. This CME may graze the Earth’s magnetic field anytime between late on 8 February and early on 9 February (UT).
The first column below includes red continuum images, each 0.09 sec exposure; and the second column hosts H-alpha line center images, each 0.15 sec exposure. Each of the four images covers 7.8’x11.4′ on the sky. Celestial north is up, west is right in each image.
 Four spotted active regions (labeled) cross the center of the Solar disk. Four spotted active regions (labeled) cross the center of the Solar disk. |
 AR 14366 (right) has become increasingly quiet, only producing a few C-class flares today. AR 14366 (right) has become increasingly quiet, only producing a few C-class flares today. |
 The two spots in the upper right appear in the top image. The one near bottom, left of center, is AR 14371. The two spots in the upper right appear in the top image. The one near bottom, left of center, is AR 14371. |
 AR 14371 (left), and 14368 (upper right) along with a filament (bottom center). AR 14371 is becoming increasing AR 14371 (left), and 14368 (upper right) along with a filament (bottom center). AR 14371 is becoming increasing |
Solar activity is expected to be moderate to high due to continued M-class flaring with a chance for an X-class flare from AR 14366 through 8 February.
February 5, 2026
Solar activity was high due to the frequent occurrences of M-class flares from various regions today. There were ten M-class flares from three regions (AR 14362, 14366, and 14372). AR 14366 contributed most of these as it slowly decays and simplifies. AR 14369 grew some while 14370 decayed, and the remainder of the regions were stable or in decay.
We monitored AR 14366 for most of the day today. We managed to observe one M-class flare but the other M-class flares that occurred during the period were from AR 14362 (two events, an M1.8 and an M2.2). No further X-class flare has happened since the impulsive X4.2 at 12:13 UT on 4 February.
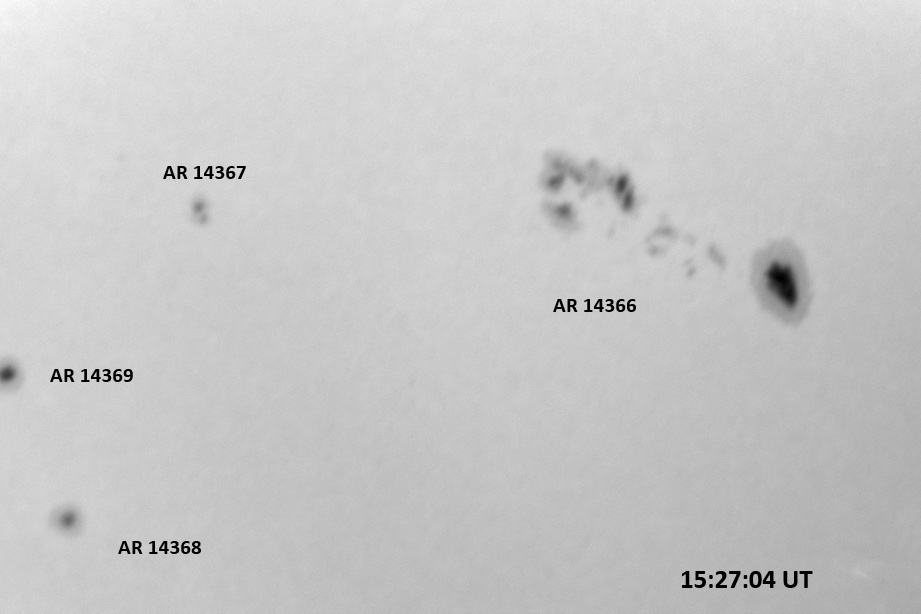
The first column below includes red continuum images, each 0.09 sec exposure; and the second column hosts H-alpha line center images, each 0.15 sec exposure. Each of the four images covers 7.8’x11.4′ on the sky. Celestial north is up, west is right in each image.
 AR 14366 (larger spot group) is being trailed by 14367 (left). AR 14366 (larger spot group) is being trailed by 14367 (left). |
 AR 14366 has been the source of a couple M-class flares today. AR 14366 has been the source of a couple M-class flares today. |
 Four spotted active regions are visible in this image. Four spotted active regions are visible in this image. |
 This part of the Sun has been mainly quiet today. This part of the Sun has been mainly quiet today. |
Solar activity is expected to be moderate to high due to continued M-class flaring with a good chance for an X-class flare from AR 14366 through 7 February.
February 4, 2026
Solar activity remains at high levels due to the ongoing activity of AR 14366. It produced an X4.2 today at 12:12 UT today. This occurred nearly a day after an X1.5 flare at 14:08 UT on 3 February, followed by an M7.2. There has been a slight shrinkage in spot area, with the visual appearance of the spot group this morning being a little simpler than in previous days. It is by far the largest spot group of the 9 visible active regions, at 1100 MSH. AR 14372, in the southeast quadrant of the solar disk, emerged yesterday but is already in decay today. AR 14358 developed a few new sunspots after decaying to a spotless region yesterday. AR 14371 is showing growth, as is AR 14362. The rest of the active regions were stable or in slight decay.
A large filament slowly erupted from the northwest quadrant of the solar disk beginning at 4:00 UT yesterday, 3 February. This generated a CME that lifted off the northwest limb around 18:00 UT. Several other filaments are visible today across the solar disk, as well as a well developed hedgerow prominence on the east southeastern limb.
Observations resumed today but with glitches in communication between the mount and computer ongoing. AR 14366 produced an M1.8 flare at 15:34 UT, prior to our opening the dome at 17:00 UT. However, since opening and through our closure at 20:02 UT due to overspreading mid- to high-level clouds, solar activity dropped back to low levels. There had not been any further M-class activity since this morning’s M1.8, through 23:20 UT today (4 February).
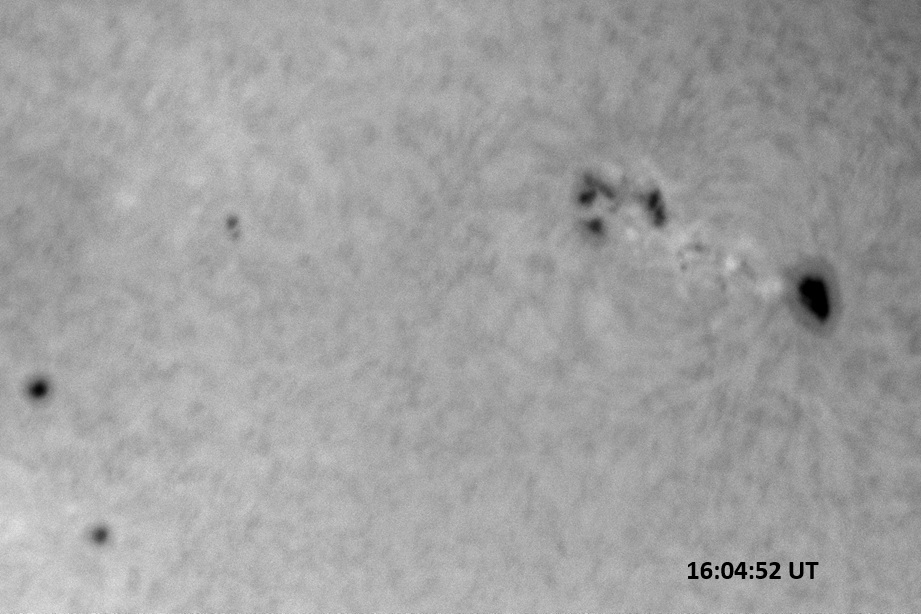
The first column below includes red continuum images, each 0.09 sec exposure; and the second column hosts H-alpha line center images, each 0.15 sec exposure. Each of the four images covers 7.8’x11.4′ on the sky. Celestial north is up, west is right in each image.
 AR 14366 is the largest spot group on the visible disk. AR 14366 is the largest spot group on the visible disk. |
 AR 14366 was the most active spot group, and had been for four days now. AR 14366 was the most active spot group, and had been for four days now. |
 Many small active regions trail AR 14366. Many small active regions trail AR 14366. |
 These regions have been comp These regions have been comp |
Solar activity is expected to be moderate to high due to continued M-class flaring with a good chance for an X-class flare from AR 14366 through 6 February.
February 2, 2026
Another attempt to collect solar observations was made this morning. The connection was successfully established with the mount and camera, but when commanded to slew to the Sun, the mount put itself in a safe mode and would not move. This error repeated for all three of the attempts made. We will be making further attempts to get the problem fixed Wednesday and Thursday of this week.
Solar activity has surged to very high levels in the last two days. A new spot group appeared on the Sun and grew explosively. It was invisible on the 28th of January, appeared as a simple pair of spots on the 29th, added new spots and began to fill in on the 30th; by the 31st it had grown dramatically and continued to do so through the 1st and 2nd of February. This is AR 14366, which, in the past 24 hours or so, produced 23 M-class flares and 4 X-class flares, the largest of which was an X8.1 that happened at 23:57 UT yesterday. The complex series of events launched a tangle of three coronal mass ejections into space, but they appear to be on track to mostly miss the Earth
This is an animated GIF image (click on the image for the animation) that shows the flare in action. It is an animated series of images taken in extreme ultraviolet light from the Solar Dynamics Observatory and posted to Spaceweather.com. Solar activity is expected to remain moderate through 4 February with frequent M-class flares (80% probability of occurrence) and occasional X-class flares (40 % probability of occurrence) due to AR 14366.
January 28, 2026
Solar activity reached has been low the last 7 days. The last X-class flare, an X1.9, was on 18 January; the last M-class flare, an M3.4, happened on 21 January. Unfortunately due to a malfunction in our system, we were unable to observe today after being offline for 9 days due to inclement weather. I have no information on when we will be able to remedy the issue, so for the foreseeable future, we will not be able to make further observations from the East Dome.
January 19, 2026
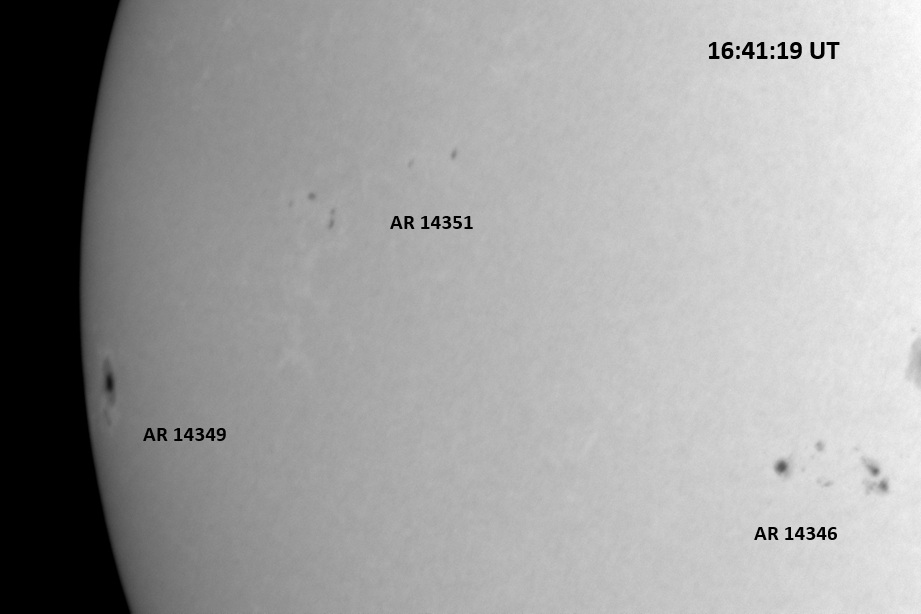
Solar activity reached high levels yesterday (18 January) as a result of a long-duration X1.9/3B flare from AR 14341. This event peaked at 18:09 UT on 18 January. This launched a coronal mass ejection that took only 25 hours to impact the Earth’s magnetic field, producing widespread bright aurorae in Europe. There are eleven spotted active regions on the Sun.
After the X1.9 flare, solar activity returned to moderate levels, before trending to low later in the day. AR 14345 produced an M1.1 flare at 11:19 UT on 19 January. It the produced 8 C-class flares, ranging from C2 to C8 throughout the day. Only one other region flared, AR 14342, producing a C2. AR 14341 remained quiet all day long.
The first column below includes red continuum images, each 0.15 sec exposure; and the second column hosts H-alpha line center images, each 0.15 sec exposure. Each of the images covers 7.8’x11.4′ on the sky, unless indicated otherwise. Celestial north is up, west is right in each image.
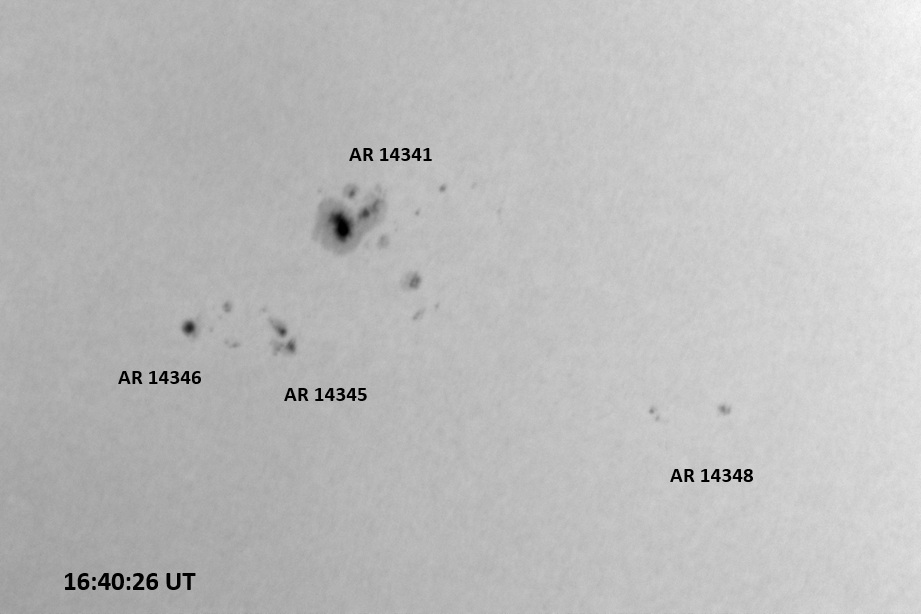 More spotted groups are visible on the Sun these days. More spotted groups are visible on the Sun these days. |
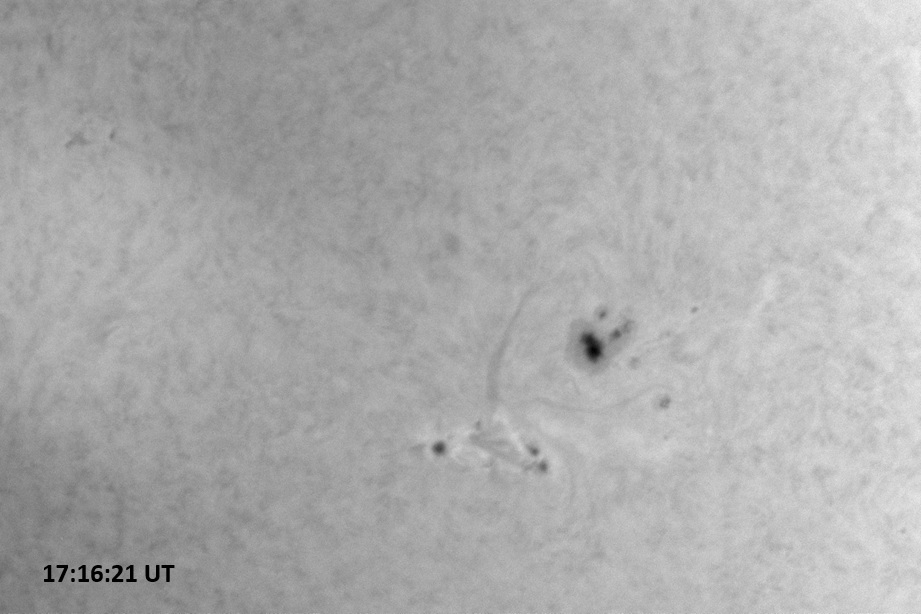 This zone on the Sun was rather active, with most of the flare activity coming from the small spot group below AR 14341. This zone on the Sun was rather active, with most of the flare activity coming from the small spot group below AR 14341. |
 Two spot groups are visible on this part of the Sun. Two spot groups are visible on this part of the Sun. |
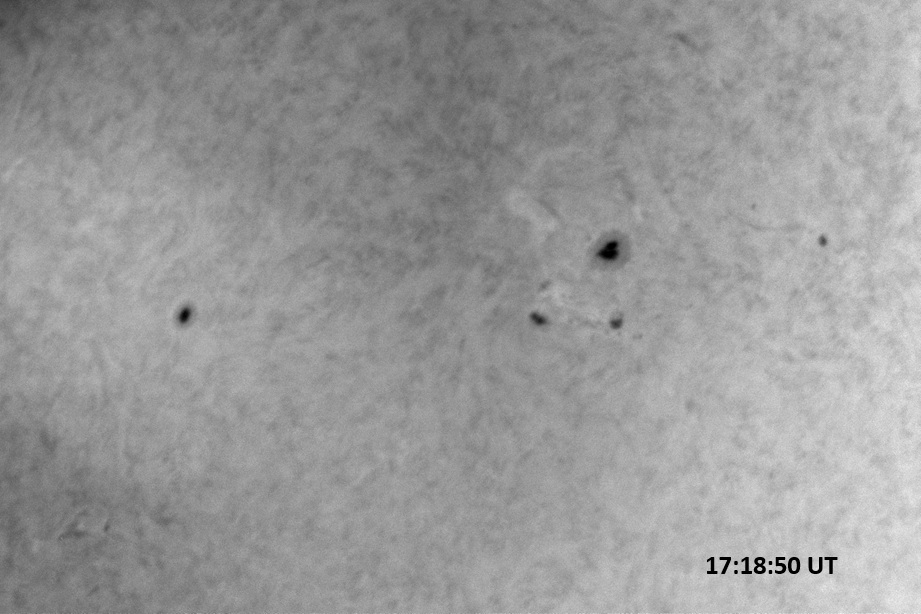 AR 14347 (single spot, left), and 14342 (just right of center). AR 14347 (single spot, left), and 14342 (just right of center). |
 Some additional spots trail the main centers of activity and are labeled above. Some additional spots trail the main centers of activity and are labeled above. |
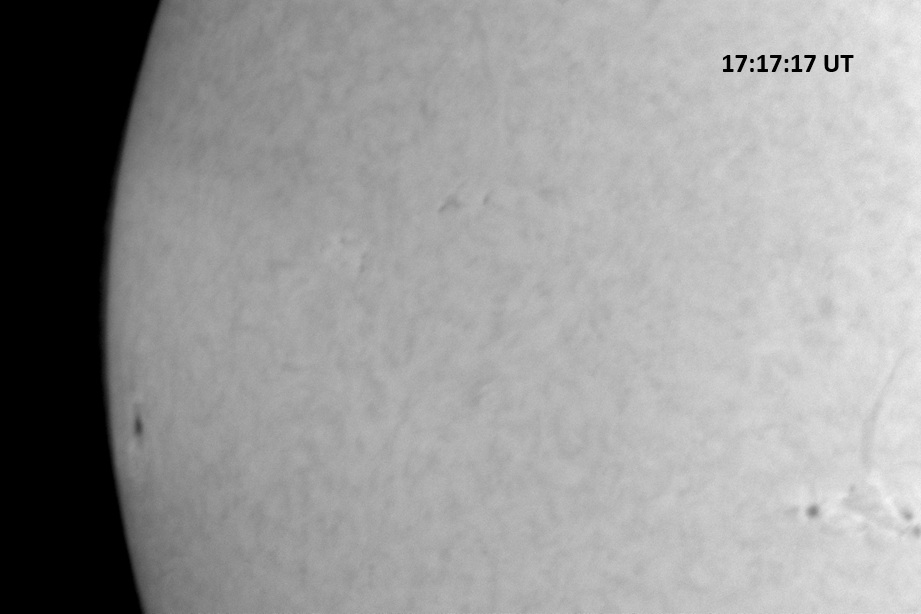 This zone of the solar disk, remains quiet for the time being. This zone of the solar disk, remains quiet for the time being. |
Solar activity is likely to be moderate, with a slight chance of additional X-class flares through 21 January.
January 16, 2026
Solar activity was low. The largest flare so far today (through 22:30 UT, 16 Jan.) was a C6.6/SF from AR 14345, a newly formed region just south of AR 14341. AR 14341 continues to be the largest (420 MSH) and most complex (beta-gamma-delta magnetic configuration) active region on the visible solar disk but it also remained quiet all day. It only produced two optical subflares and a C1 so far today.
The first column below includes red continuum images, each 0.09 sec exposure; and the second column hosts H-alpha line center images, each 0.15 sec exposure. Each of the images covers 7.8’x11.4′ on the sky, unless indicated otherwise. Celestial north is up, west is right in each image.
 AR 14336 departs over the west limb. It is the second largest spot at 150 MSH AR 14336 departs over the west limb. It is the second largest spot at 150 MSH |
 AR 14336 (and this zone of the Sun) has been completely quiet today. Two filaments remain visible north of the region. AR 14336 (and this zone of the Sun) has been completely quiet today. Two filaments remain visible north of the region. |
 AR 14343 lower part) and 14340 (upper right). AR 14343 continues to grow while 14340 continues to decay. AR 14343 lower part) and 14340 (upper right). AR 14343 continues to grow while 14340 continues to decay. |
 AR 14343 was the source of 2 C1 flares and one c4 flare today. This was one of the most active spot groups today. AR 14343 was the source of 2 C1 flares and one c4 flare today. This was one of the most active spot groups today. |
 AR 14342 (top center), 14347 (single spot near limb, upper left) and 14341 (bottom center). AR 14342 (top center), 14347 (single spot near limb, upper left) and 14341 (bottom center). |
 These regions were relatively quiet today. A filament is visible toward the right of the image. These regions were relatively quiet today. A filament is visible toward the right of the image. |
Solar activity is expected to be low, with a chance for M-class flares and a slight chance for X-class flares through 18 January.
January 15, 2026
Solar activity was at moderate levels due to an M1.6 flare that happened at 20:33 UTC on 14 January from AR 14341. This region also produced a C9.7 flare at 6:36 UTC on 15 January. Since then, and through 00:10 UTC, 16 January, solar activity returned to low levels, with only infrequent low-level C-class flaring. AR 14343 has grown quite a bit since yesterday, but was otherwise inactive. A Coronal Mass Ejection came from the area of AR 14340, but the bulk of this debris has been launched northward and is expected to miss the Earth.
The first column below includes red continuum images, each 0.09 sec exposure; and the second column hosts H-alpha line center images, each 0.15 sec exposure. Each of the images covers 7.8’x11.4′ on the sky, unless indicated otherwise. Celestial north is up, west is right in each image.
 The lone spot AR 14336 is rotating toward the limb of the Sun. The lone spot AR 14336 is rotating toward the limb of the Sun. |
 This image also includes a filament (top center), along with an inactive AR 14336. This image also includes a filament (top center), along with an inactive AR 14336. |
 AR 14340 (top center) and 14343 (below left), the latter of which has grown since yesterday. AR 14340 (top center) and 14343 (below left), the latter of which has grown since yesterday. |
 This zone of the sun remains quiet, with 14340 nearly disappearing in H-alpha. This zone of the sun remains quiet, with 14340 nearly disappearing in H-alpha. |
 AR 14341 (below left), 14342 (upper right) and 14343 (lower right), AR 14341 (below left), 14342 (upper right) and 14343 (lower right), |
 AR 14341 (lower left) and 14342 (upper left), along with a filament (just right of image center). AR 14341 (lower left) and 14342 (upper left), along with a filament (just right of image center). |
Solar activity is expected to be low, with a 25-30% chance for M-class flares from 15 to 17 January.
January 14, 2026
Solar activity is now back to moderate levels. The largest flare over the last 7 days was an M3.3 at 23:10 UTC on 11 July from AR 14341, which was behind the solar limb at the time. Then there was a C9.6 at 3:50 UTC on 14 January. Just happened was an M1.6/1F at 20:32 UT from AR 14341. Slight decay occurred in AR 14334 (barely visible as a single spot) and 14336 (a large spot with a few attendants trailing behind). AR 14340, which emerged several days ago, has also demonstrated some decay. AR 14341 and 14342 are situated along the eastern limb of the Sun and contributed almost all of the flaring activity over the last two days.
The first column below includes red continuum images, each 0.09 sec exposure; and the second column hosts H-alpha line center images, each 0.15 sec exposure. Each of the images covers 7.8’x11.4′ on the sky, unless indicated otherwise. Celestial north is up, west is right in each image.
 This active region sported many more spots a few days ago but has decayed to what is visible in this image. This active region sported many more spots a few days ago but has decayed to what is visible in this image. |
 AR 14336 along with a single filament (upper left quadrant of image). This part of the Sun has been quiet. AR 14336 along with a single filament (upper left quadrant of image). This part of the Sun has been quiet. |
 AR 14340 nearing the solar central meridian. AR 14340 nearing the solar central meridian. |
 AR 14340 (top center) has been quiet. In the lower left corner, the bright spot marks another region emerging into view. AR 14340 (top center) has been quiet. In the lower left corner, the bright spot marks another region emerging into view. |
 AR 14341 (bottom) and AR 14342 (top) are rotating into view. Small spots from a newly emerging sunspot group are visible in the lower right corner of the image. AR 14341 (bottom) and AR 14342 (top) are rotating into view. Small spots from a newly emerging sunspot group are visible in the lower right corner of the image. |
 AR 14341 and 14342 as they rotate into view, led by a filament (just right of image center). A new sunspot group is emerging (lower right corner). AR 14341 and 14342 as they rotate into view, led by a filament (just right of image center). A new sunspot group is emerging (lower right corner). |
Solar activity is expected to be low, with a 25% chance for M-class flares from 14 to 16 January.