
Energy & Environment Research
Personnel
Raghava R. Kommalapati, PhD, PE, BCEE, Group Lead
Introduction
The Energy & Environment (E&E) research group at Center for Energy & Environment (CEES), Prairie View A&M University performs research principally in three areas: (i) sustainable nuclear energy, (ii) photochemical modeling, and (iii) life cycle assessment for different energy technologies. This webpage provides an overview of the objectives and significant findings to date in association with each of the above mentioned three research areas.
SUSTAINABLE NUCLEAR ENERGY (SNE)
Objective
- Identify back-end fuel cycle management strategies for safe operation of nuclear power plants and waste management by (a) computing nuclear fuel burnup calculations that give important insights about the consumption and build-up of radionuclides during and after fuel fission in the nuclear reactor core and (b) analyzing the performance of different nuclear fuel grades on the radioactivity of the final fresh fission products.
Methodology Adopted
- Nuclear fuel burnup was carried out for 220 days with a 30 day time step and the total radioactivities of radionuclides of the freshly burnt fuel were analyzed at the end of the burn step. Burnup calculations were done for uranium (235U, 236U, 238U), plutonium (239Pu, 240Pu, 241Pu, 242Pu), xenon (135Xe), and cesium (134Cs).
- Different materials were analyzed for cladding that included stainless steel, zircaloy, and zirconium. The nuclear fuel clad material plays a very important role in preventing radioactive fission products from escaping into the coolant and conducts heat away from the fuel. The better clad material is identified based on the values of effective neutron multiplication factor (Keff).
Significant Findings
- Figure 1 presents the burnup times of certain select nuclear fuels.
- Burnup calculation results indicated that there is a buildup of plutonium isotopes for UOX and CEU, whereas there is a decline in the plutonium radioisotopes for MOX fuel with burnup time. For MOX fuel, there is an observed decrease of 31.9% of fissile plutonium isotope where as for UOX and CEU, the fissile plutonium isotope increased by 82.3% and 83.8% respectively.
- The Keff results showed zircaloy to be a much more effective clad material relative to zirconium and stainless steel.
Figure 1: Burnup times for certain select nuclear fuels.
PHOTOCHEMICAL MODELING (PCM)
Objectives
- Evaluate the contributions of point source emissions to ozone (O3) production in the Houston-Galveston-Brazoria (HGB) area using Comprehensive Air Quality Model with extensions (CAMx) photochemical model Version 5.40.
- Determine the sensitivity of O3 to other air contaminants in the HGB area with emphasis on nitrogen oxides (NOx) and volatile organic compounds (VOCs).
- Evaluate the impacts of transportation on Houston air quality
Methodology Adopted
- Figure 2 illustrates the (a) HGB study area and (b) CAMX modeling domain features with coordinates.
- Considered three emission scenarios: (a) ALL: all five emission sources (point, area, mobile, biogenic, and non-road) included, (b) HGB: same as ALL; the exception being point sources restricted to those within the HGB area, and (c) WOP: same as ALL; excluding all point sources when evaluating the contributions of point sources.
- Considered two emission scenarios: (a) I: only mobile and biogenic source emissions were used as CAMx inputs, (b) II: all five (point, area, mobile, non-road mobile, and biogenic) sources of emissions for evaluating transportation impacts on air quality in Houston.
- Processed CAMx input files with appropriate software: EPS3 (point and area emission sources), MOVES (mobile emission sources), GloBEIS (biogenic emission sources), NON-ROAD (non-road emission sources), WRF (meteorology), and GOES-Chem (boundary conditions).
- CAMx simulated output visualized with VERDI software.
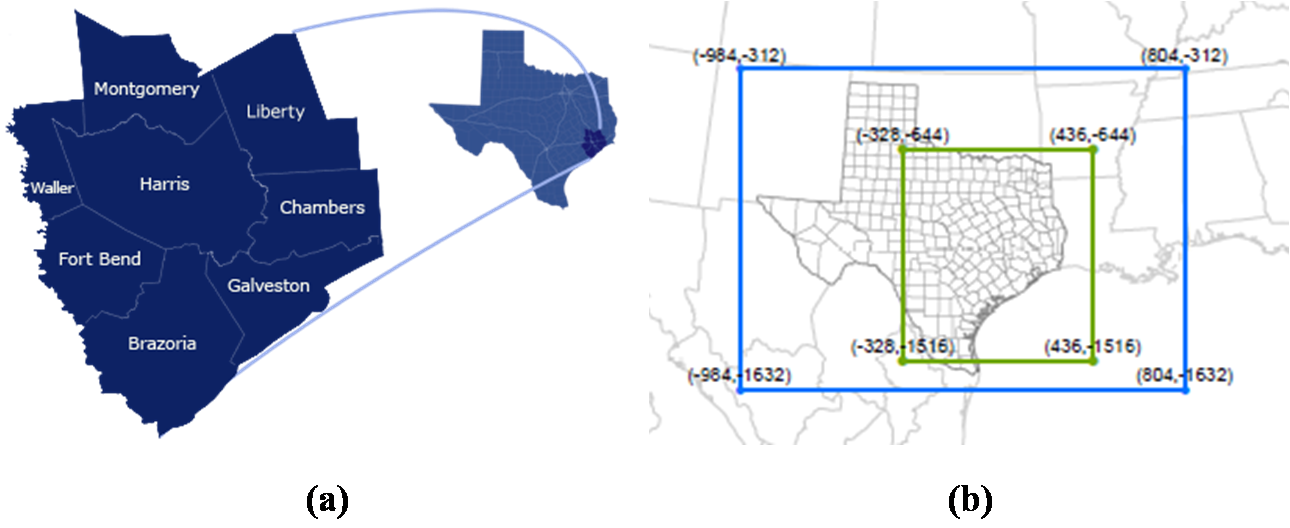
Figure 2: (a) HGB study area and (b) CAMx domain features. (Source: TCEQ, 2014)
Significant Findings
- Figure 3 shows the O3 concentration for all three emissions scenarios considered.
- Percentage O3 concentration differences for case HGB vs. ALL were higher than for case WOP vs. ALL (refer Figure 3), thereby, indicating significant contributions of point sources to O3 formation in the HGB area. A decrease in point source emissions would reduce O3 exceedances.
- The O3 formation dependency moved from H2O2 dependency in the morning time towards the HNO3 dependency in the afternoon. O3 formation in the mornings is characterized as VOC control regime having lower solar radiation, while in the afternoon it is a NOx limited regime with air pollutants transport and higher photochemical activities.
- Figure 4 shows the time series of NO concentrations from simulations I & II for weekend and weekday. The linear correlations (refer Figure 4) validate that vehicular source emissions play a major role in contributing to air pollution in Houston.
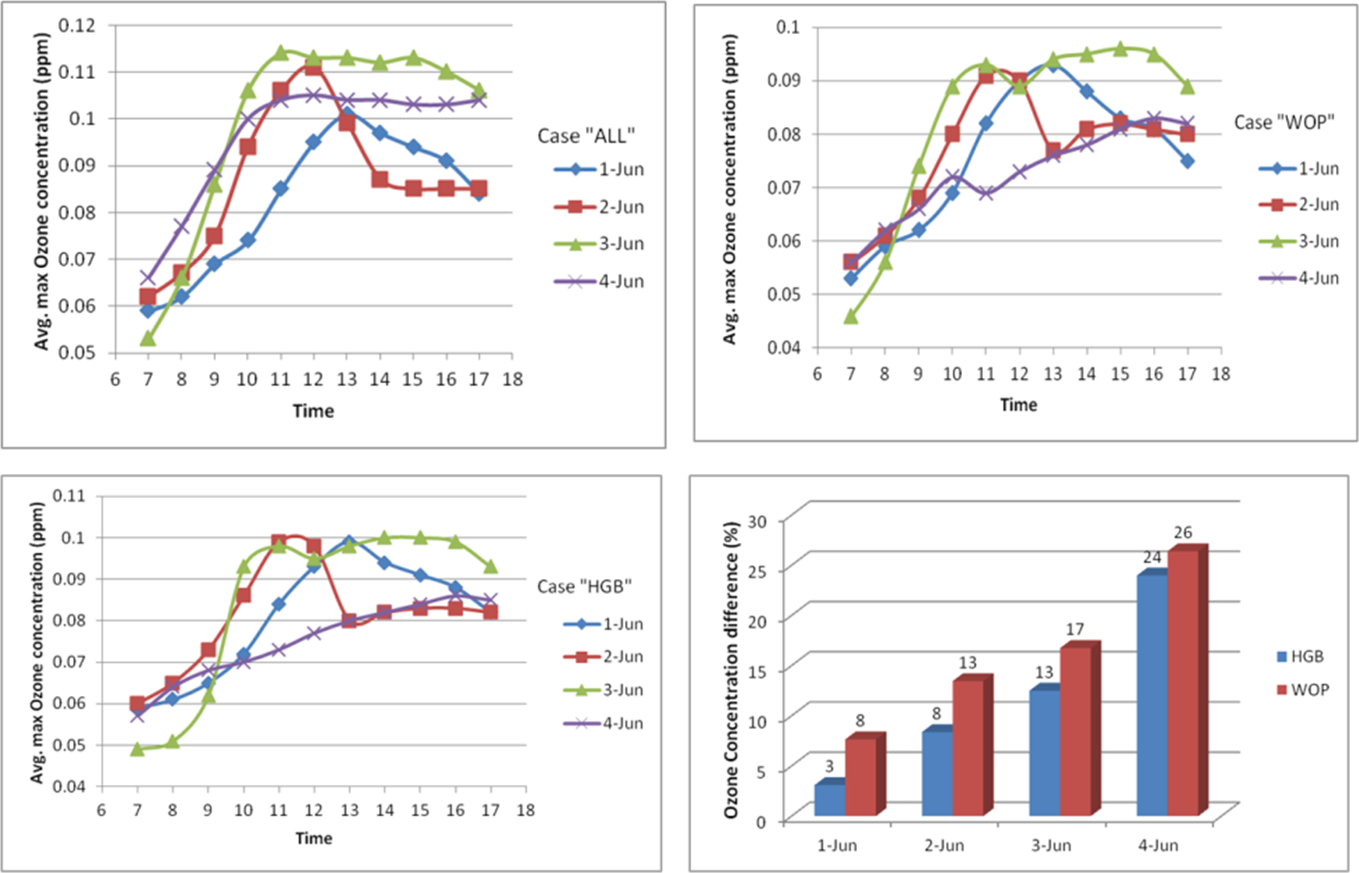
Figure 3:O3 comparison on different days between 7AM and 5PM for three case scenarios.
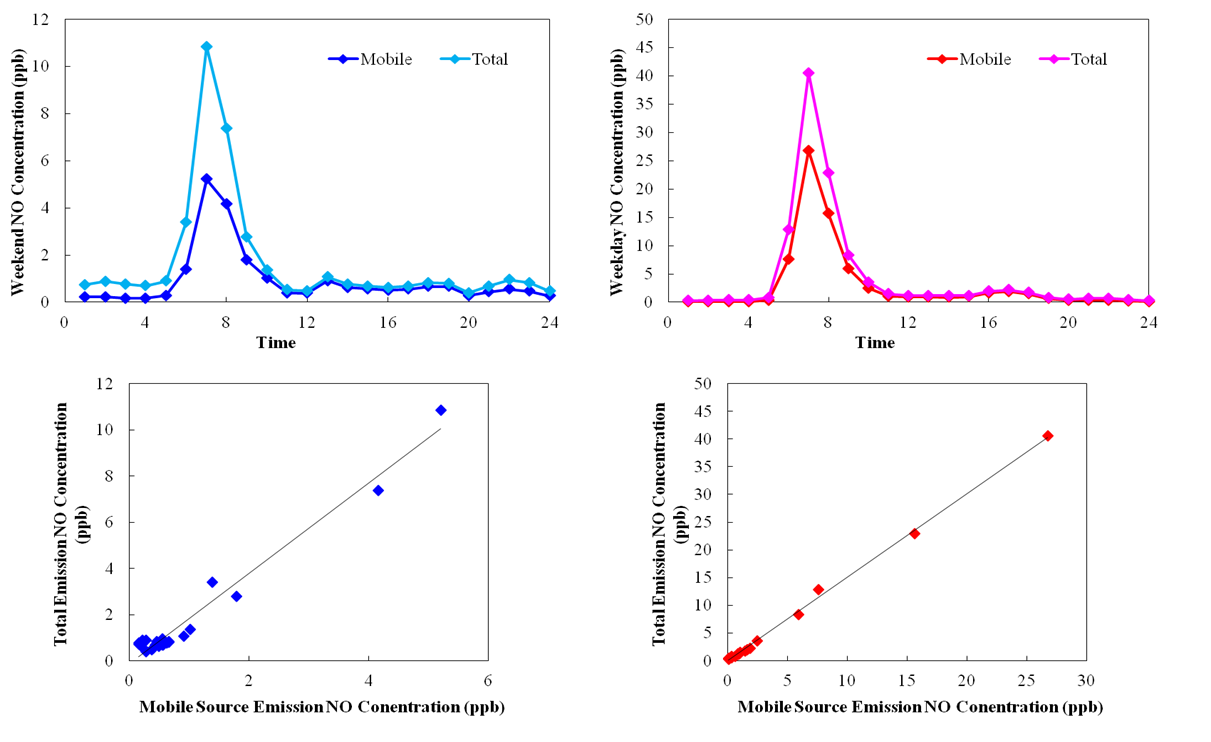
Figure 4: Simulated pollutant concentrations over weekends (left) and weekdays (right).
Ongoing/Future Research
- Study the atmospheric chemistry of ambient air pollutants in HGB area in detail.
- Characterize the contributions of individual and multiple emissions sources.
- Study the impacts of having renewable energy sources as alternatives to existing non-renewable sources.
LIFE CYCLE ASSESSMENT (LCA) OF ENERGY TECHNOLOGIES
Objective
- Analyze the life cycle emissions for different energy technologies with emphasis on greenhouse gases (GHG) to identify the energy technology that produces the lowest GHG over the entire life cycle.
Methodology Adopted
- Performed LCA of wind energy, biomass, and biofuels (biodiesel and bioethanol).
- Wind energy: Performed energy input analysis of existing LCA research on wind power which presents the highest energy impact phase and impact size on energy payback period. Also, compared wind energy technology to other renewable energy technologies based on the environmental impacts of CO2 GHG emissions.
- Biodiesel: Different blends of biodiesel (B20, B50, B100) obtained from soybean, rapeseed, and palm oil were analyzed for GHGs, VOCs, carbon monoxide (CO), NOx, sulfur oxides (SOx), and particulate matter (PM2.5, PM10) using the ‘GREET’ model that analyzes emissions for two cycle; wells-to-pump (WTP) and pump-to-vehicle (PTV).
- Bioethanol: Different blends of bioethanol (E0, E10, E15, E25, E85, E100) in varying vehicles (spark ignition (SI), flexible fuel vehicles (FFV), fuel cell vehicles (FCV)) were analyzed using the GREET model to obtain percentage reduction in emissions of GHGs, VOCs, CO, NOx, SOx, PM2.5, and PM10.
Significant Findings
- Wind energy: The highest energy input phase was manufacturing and dismantling phase of wind turbines. Energy payback period was noted to be directly proportional to the wind turbine size. Figure 5 presents a comparison of wind energy CO2 emissions against other energy technology CO2 emissions per kilowatt-hour (kWh) produced. Wind energy is one of the best choices to mitigate the climate change when it comes to CO2 GHG emissions.
- Biodiesel: Figure 6 presents the GREET LCA model output for different biodiesel blends obtained from soybean, rapeseed, and palm oil. Irrespective of the feedstock, there was a reduction of GHGs emissions. The higher the blend ratio of biodiesel to petro-diesel, the higher was the reduction in GHGs and increase in other pollutants. NOx emissions only reduced in the case of soybean based biodiesel.
- Bioethanol: Figure 7 presents the GREET LCA model output for percentage reduction in emissions of passenger cars for WTP and PTV stages. WTP analysis show that only GHGs reduce with higher blends of bio-ethanol. FCV using 100% bio-ethanol have shown the most reduction in the amount of all the pollutants from well-to-vehicle emission analysis. CO and PM2.5 emissions increased for increasing bio-ethanol fuels blend ratio. All other pollutants (VOC, NOx, SOx, PM10) increased emissions until E85 blending ratio.
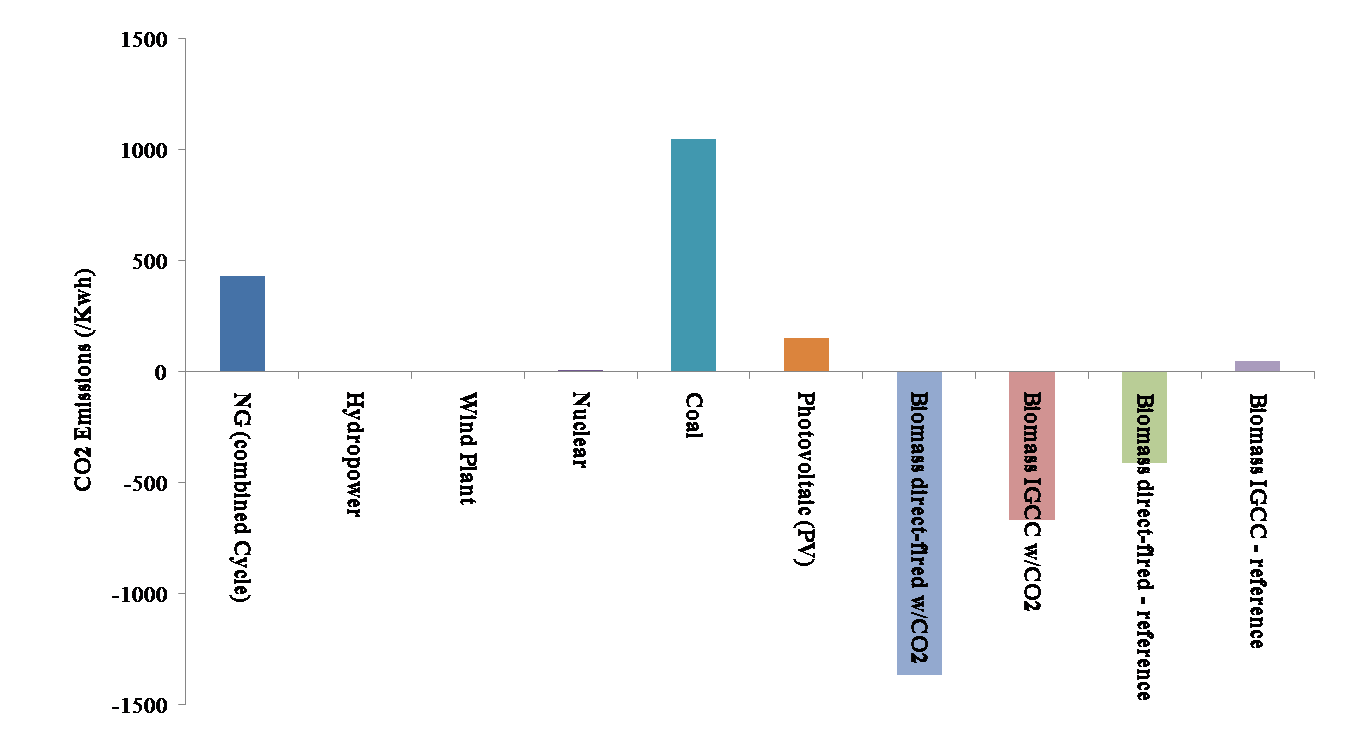
Figure 5: Comparison of wind energy with other energy generation technologies per kWh.
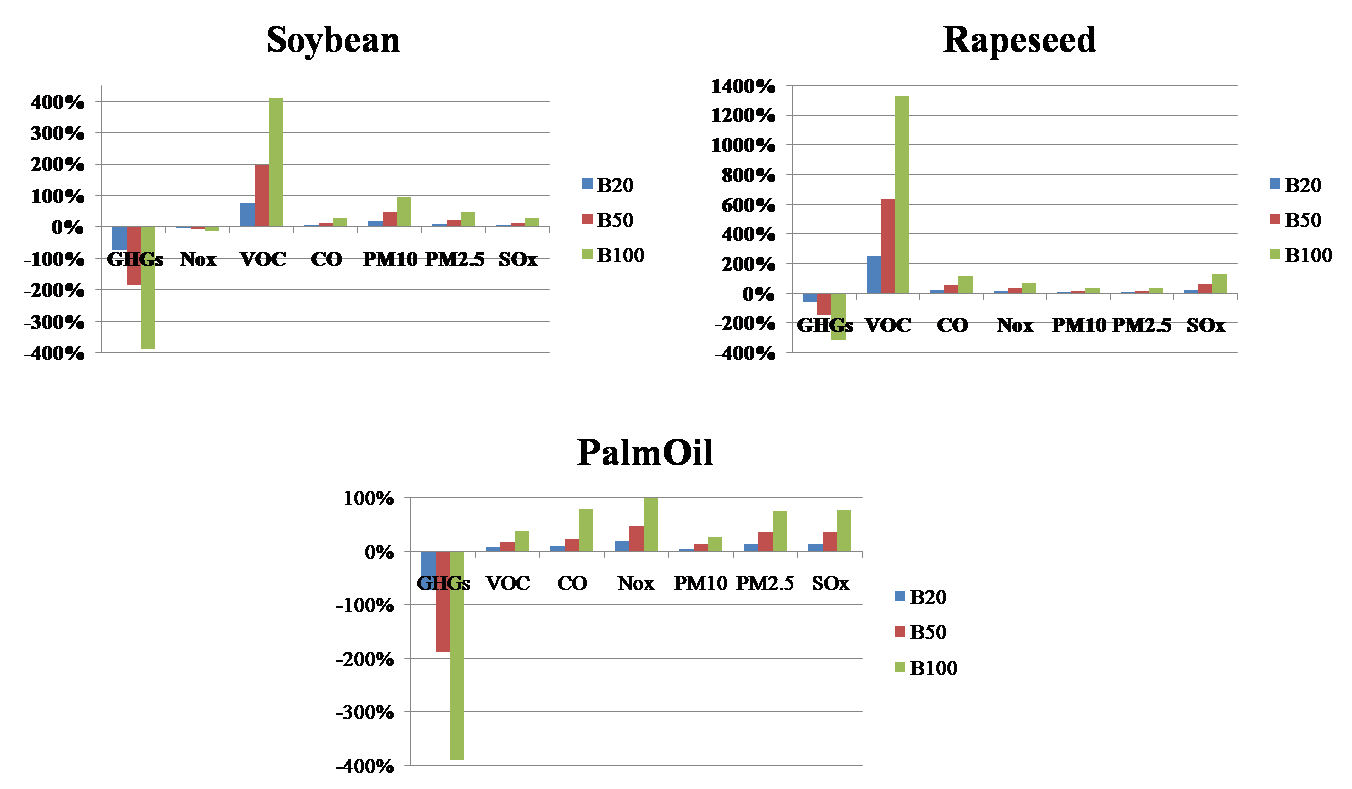
Figure 6: Comparison of emissions from different biodiesel blends obtained from soybean, rapeseed, and palm oil.
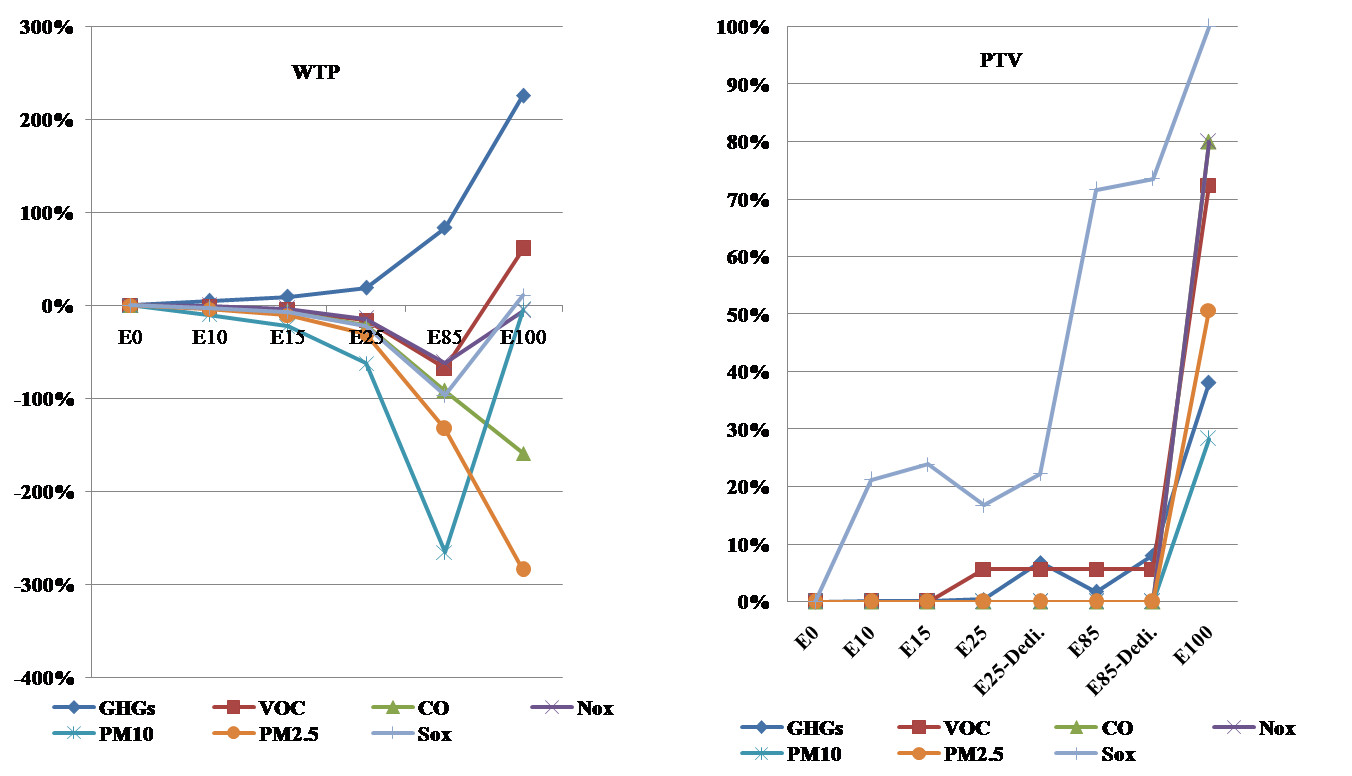
Figure 7: Percentage reduction of emissions for passenger cars for WTP and PTV.
Ongoing/Future Research
- Perform the life cycle assessment of other energy technologies to identify the best energy technology that produces least GHG emissions.